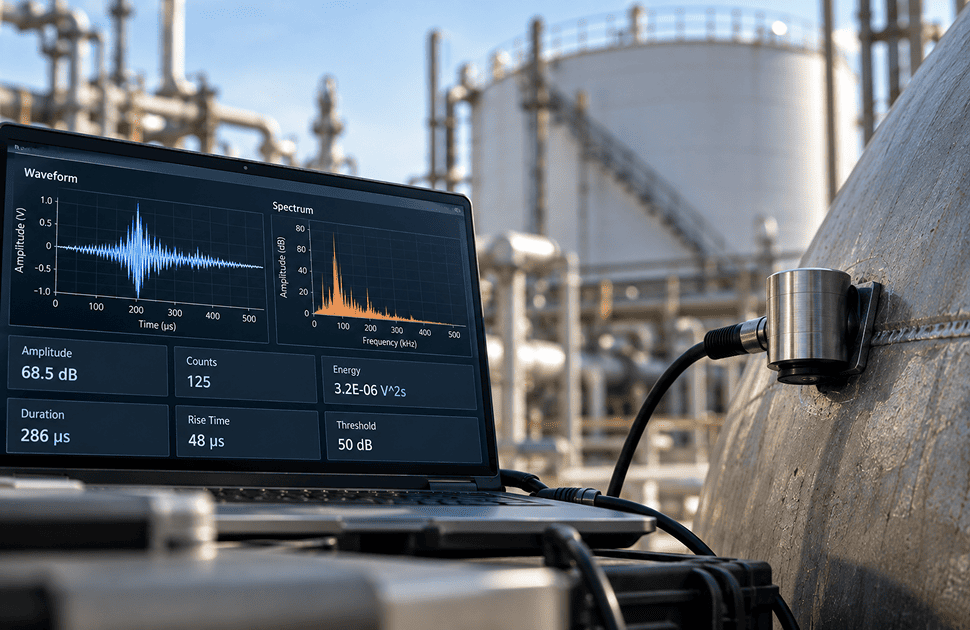
An acoustic emission system does not hand you a waveform to interpret. It hands you numbers. A test on a single vessel can produce hundreds of thousands of signals, and nobody reads those one by one. The instrument reduces each signal to a small set of measured features, and every decision that follows rests on them.
Knowing what each number measures, and what each number is sensitive to, is the difference between reading acoustic emission data and guessing at it.
Where the definitions come from
The terminology is governed by ASTM E1316, the standard terminology for non-destructive examinations, whose acoustic emission section defines the vocabulary the industry works in. The current revision is E1316-26a, issued in 2026, and these definitions have stayed textually stable across recent revisions.
One point saves confusion later: not every term in daily use is a standardised one. Words such as "hit", "MARSE" and "ring-down count" are pervasive in field practice and instrument software, but they originate in instrumentation rather than in E1316, whose formal vocabulary favours "AE signal" and "energy". Both are legitimate. Knowing which is which matters when writing a procedure that has to satisfy a code.
Threshold: the setting everything else depends on
Before any parameter can be measured, the instrument has to decide that a signal exists at all. That decision is made by the threshold, a voltage level that the incoming signal must exceed before the system starts recording.
E1316 distinguishes two: the examination threshold, governing what gets recorded, and the evaluation threshold, governing what gets analysed. Data may be captured at a lower level than it is assessed at. On pressure equipment, collecting at 40 dB and evaluating at 50 dB is common, though the right value is always the one set above measured background noise on that structure, not a number carried over from the last job.
Threshold is not merely a filter. It directly changes the value of several parameters, which is why two crews can test the same asset and report different numbers without either being wrong.
The hit and its anatomy
When a signal crosses the threshold, the system registers what practitioners call a hit: one detected transient on one channel. A single physical event usually produces several hits, one per sensor that detects it, and comparing their arrival times is what makes source location possible.
Deciding where a hit ends is handled by three timing settings. Peak Definition Time (PDT) controls how long the system keeps looking for a higher peak before fixing the peak amplitude. Hit Definition Time (HDT) sets how long the signal must stay below threshold before the hit is declared over. Hit Lockout Time (HLT) then blocks new triggering, so late reflections are not counted as fresh events.
These are instrumentation settings, not code requirements, and no authoritative table of correct values by material exists. They are set for the specific structure, usually alongside pencil lead break tests. Getting them wrong corrupts data predictably: too long a Hit Definition Time merges separate events into one, too short a value splits one event into several.
From each hit, the system extracts the following.
Counts. E1316 defines the emission count as the number of times the signal exceeds the preset threshold during a selected portion of a test. It is a tally of threshold crossings, with no unit. A large event may produce many counts, a small one only a handful. Because the tally depends on threshold, amplifier gain, coupling quality and sensor frequency response, counts are informative within one setup and close to meaningless across different ones.
Amplitude. The peak voltage of the largest excursion in the signal. This is the parameter that determines whether a signal is detected at all, since anything below threshold is never recorded. It is a deciding factor in type of event happened. It is reported in decibels, and the way that scale is constructed is worth setting out properly.

Typical AE Signal and Parameters (Source: Acoustic Emission Testing Handbook)
The decibel scale, and why preamplifier gain does not distort it
E1316 defines the amplitude scale as twenty times the base ten logarithm of the measured voltage divided by a reference voltage. The reference is one microvolt at the sensor, before amplification, and the measured voltage is referred to the same point.
That detail answers a question that recurs constantly in Level II training. If a preamplifier applies 40 dB of gain, does the reported amplitude include it? It does not. Because reference and measurement are both referred to the sensor input (Reference voltage: 1 µV), the gain is arithmetically removed, and the figure describes the signal the structure produced rather than the one the electronics delivered.
The scale runs as follows.
Note the factor of twenty rather than ten in the formula. Voltage is an amplitude quantity rather than a power quantity, and the twenty-times convention is what keeps the decibel scale consistent when it is applied to a voltage.
Rise time and duration
Rise time is the interval from signal start to peak amplitude, in microseconds. Duration runs from signal start to the final threshold crossing.
Both describe signal shape in time, and both help separate genuine emission from nuisance sources. Long duration with low amplitude is a familiar signature of friction rather than a growing crack. Both are also threshold-dependent: raise the threshold and the last crossing occurs earlier, so measured duration shortens even though the physical event was identical.
Energy, and the terminology problem around it
Energy is what most practitioners rely on for severity, and also where terminology causes the most trouble, because three different quantities travel under the same name.
E1316 defines the energy of an acoustic emission signal as the integral of the volt-squared function over time, giving units of volts squared multiplied by seconds. Instrument manufacturers additionally report MARSE, the measured area under the rectified signal envelope, which integrates the absolute value of the voltage rather than its square. Some systems report absolute energy, computed as the volt-squared integral divided by resistance and expressed in attojoules, which are units of ten to the power minus eighteen joules.
These are genuinely different quantities. Squaring a signal is not the same operation as rectifying it, and volts times seconds is not comparable with attojoules. When reading or writing a report, state which is meant.
Energy dominates severity assessment because it captures amplitude and duration in one figure and is far less sensitive to threshold than counts or duration. MARSE became the central parameter in intensity analysis for pressure equipment for that reason, and it is what ASME Boiler and Pressure Vessel Code Section V requires a system to measure for each hit, alongside counts, peak amplitude and arrival time.

Total Energy Plot in a Storage Tank Bottom Inspection
Measuring continuous emission
Not all acoustic emission arrives in discrete bursts. A leak, or a rubbing bearing, produces a signal that never returns below threshold and so has no measurable start, end, rise time or duration. Threshold-based features cannot describe it.

Burst Type Activity (Low ASL)

Continuous Activity (High ASL)
Two parameters handle this. AE RMS is the rectified, time-averaged signal on a linear scale, in volts. Average Signal Level, or ASL, is the same idea expressed logarithmically on the decibel scale, referring to the same one microvolt at the preamplifier input. ASL is widely used to quantify leakage and rubbing.
The burst versus continuous distinction is one of the more reliable interpretive tools available. Burst signals point to discrete events such as crack extension, fibre fracture or delamination. Continuous emission points to flow, friction or plastic deformation.
Frequency-based parameters
Systems also derive frequency measures. Average frequency is counted divided by duration. Peak frequency is where the signal's spectrum reaches its maximum, and frequency centroid is the magnitude-weighted mean of that spectrum.
Paired with these, the RA value, rise time divided by amplitude in milliseconds per volt, supports one of the better-established classification methods available. The RILEM Technical Committee 212-ACD recommendation, developed for concrete, plots RA against average frequency to separate crack modes: tensile cracking tends toward high average frequency and low RA, shear cracking toward low average frequency and high RA. RILEM advises calculating both from a moving average of more than fifty hits, and cautions that RA values shift with threshold level.
Which parameters survive a change of setup
Parameters differ enormously in how much they depend on test configuration and treating them as equally reliable is a common and costly mistake.
Distance compounds this. Signals attenuate as they travel, and higher frequencies attenuate faster, so the same source registers lower amplitude, fewer counts and shorter duration at a sensor further away. A study published in Applied Sciences in 2020 measured this on concrete and found that across the same range of impact energies, counts rose by roughly five and a half times close to the source but only about twice at a distance of eight metres. In other words, the further away the sensor, the less the parameter values tell you about how energetic the source actually was.
So raw values should not be compared between channels without accounting for distance, and a quiet channel may mean a distant source rather than a healthy region.
Reference table
Key takeaways
Acoustic emission parameters are not interchangeable measures of the same thing. Each captures a different property of the signal, and each depends to a different degree on how the test was configured.
Threshold propagates furthest. It decides what is recorded at all, and it directly alters counts, duration and rise time. Amplitude and energy travel best between setups, which is why severity assessment rests on them rather than on raw activity counts.
No parameter should be read without regard to sensor position either. Attenuation reshapes every number the instrument reports, and an inspector who forgets it will systematically underestimate distant sources.
Sources
- ASTM E1316-26a, Standard Terminology for Nondestructive Examinations, ASTM International (2026): definitions of amplitude, count, rise time, duration, energy, ASL, AE RMS, examination and evaluation threshold, and the decibel scale and its one microvolt reference.
- ASME Boiler and Pressure Vessel Code, Section V, Articles 11, 12 and 13: acoustic emission examination requirements, including the features measured per hit.
- National Board of Boiler and Pressure Vessel Inspectors, Acoustic Emission Examination of Metal Pressure Vessels: summary of ASME requirements, based on SE-610.
- RILEM Technical Committee 212-ACD recommendation (M. Ohtsu), Materials and Structures (2010), DOI 10.1617/s11527-010-9640-6: RA against average frequency crack classification, moving average guidance, threshold caution.
- S. Botten, NDT Method Overview: Basics of Acoustic Emission Analysis for Field Testing, ASNT Pulse: field threshold practice and amplitude ranges.
- NDE Resource Center (nde-ed.org), Acoustic Emission Signal Features: MARSE and signal feature definitions.
- H. Vallen, AE Testing Fundamentals, Equipment, Applications, NDT.net (2002), and Vallen AMSY system documentation: energy computation, sensor spacing and frequency band selection.
- Experimental Investigation on Effective Distances of Acoustic Emission in Concrete, Applied Sciences (2020), DOI 10.3390/app10176051: attenuation effect on measured counts with distance.
- A Review on Acoustic Emission Testing for Structural Health Monitoring of Polymer-Based Composites, PMC10422368 (2023): burst and continuous emission, parameter signatures.
- ASTM E976-15(2021), Standard Guide for Determining the Reproducibility of Acoustic Emission Sensor Response: pencil lead break verification.