Ultrasonic NDT
Selecting the Best Propagation Mode for a Reflector Using the AIM Modeling Tool for TFM (Total Focusing Method) Inspection
Published on 31st March 2020
Inspection.png)
Challenges of Choosing the Proper Settings Using TFM
When selecting a mode of propagation (wave set) for a given inspection, the inspector needs to know what kind of defects may occur in the part to be inspected.
The type of defect will give some information on the orientation of the reflector, which is critical when inspecting with ultrasound testing (UT).
With conventional Ultrasound Testing (UT), phased array UT, or TFM, the basic principle remains the same. To have a good probability of detection (POD), the sound waves need to have as much perpendicularity as possible with the reflector. Another consideration is the probe parameters.
Depending on the probe used, the energy may not be capable of reaching the targeted defect. Even though the TFM zone is drawn at a particular location, it is possible that the physics will not allow for this specific probe to focus that far into the part.
There are so many factors to keep in mind, so how can we simplify and ensure that our NDT inspection is adequate?
Same Probe Location
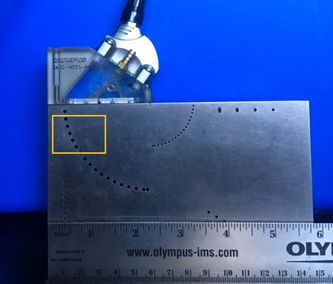
Different Modes


Solution Using the Acoustic Influence Map Modeling Tool
The OmniScan® X3 phased array flaw detector comes with a built-in scan plan tool.
Within it is an Acoustic Influence Map (AIM) modeling tool that was specifically designed for Total Focusing Method (TFM) inspection. The AIM tool helps users select the right mode of propagation, or wave set, for their inspection.
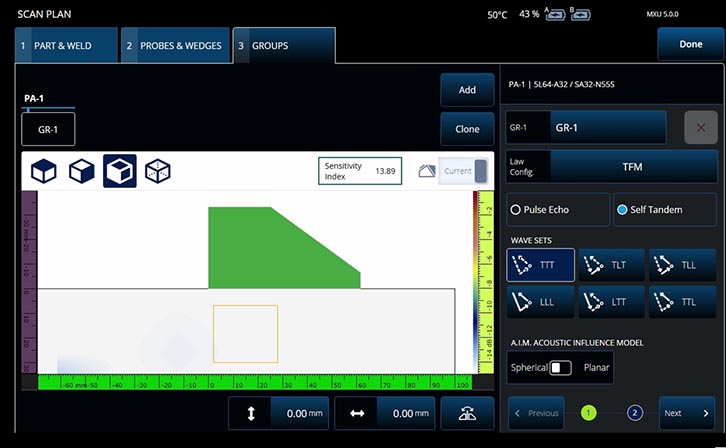
The AIM modeling tool considers multiple parameters, including the probe and wedge, velocity, thickness, geometry of the specimen, inspection technique, wave sets, and, of course, the parameters entered by the inspector in the “Influence zone” menu to describe the targeted type of defect.
A flaw’s orientation is the principal factor impacting how well a sound beam will be able to detect it. The AIM model clearly demonstrates for the user how good the signal coverage is at a particular angle for a given flaw.
Using the AIM Modeling Tool to Determine the Best Propagation Mode
The user draws the desired zone of interest and then enters the expected orientation (in degrees) of the flaw or selects “omnidirectional” for flaws that are not at an angle, such as porosity or other volumetric types of defects.
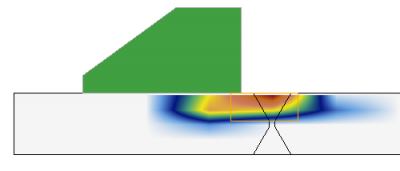
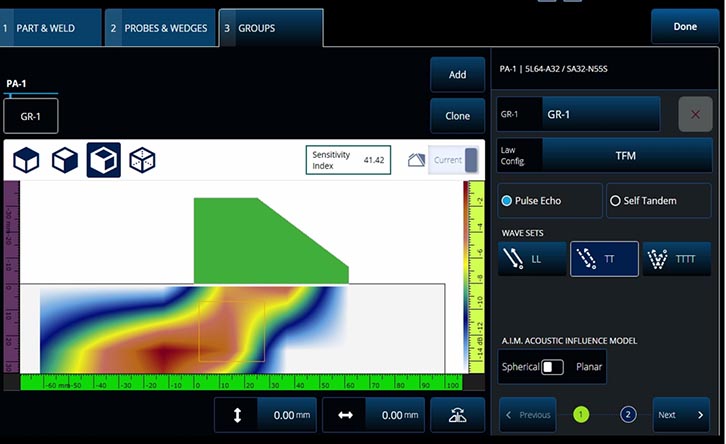
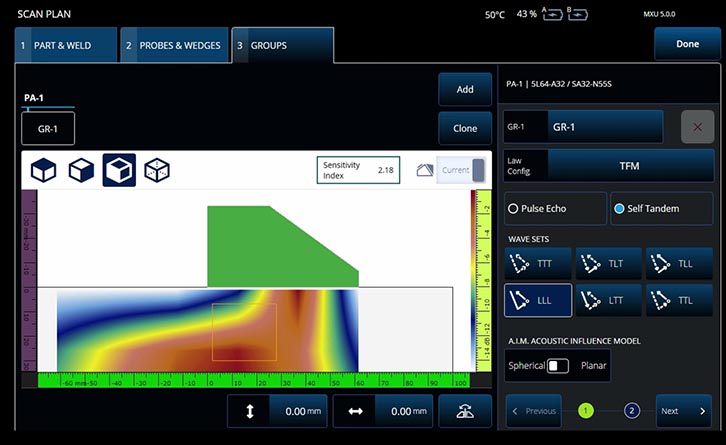
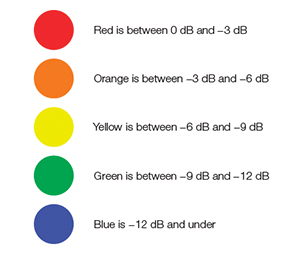
A color palette clearly identifies the sensitivity performance for each part of the zone of influence. Each color covers a three-decibel range, indicating the ultrasonic response with respect to the maximal amplitude:
Significance of the Sensitivity Index
It’s important to note that the actual value of each color varies from one map to another.
This is because the decibel range of the colors in each AIM simulation measures backward from the predicted maximum amplitude after normalization.
To enable you to compare one AIM to another, the Sensitivity Index (SI) value is provided.
The SI is a value in arbitrary units that represents the maximum sensitivity estimated for an entire map of a given waveset before normalization.
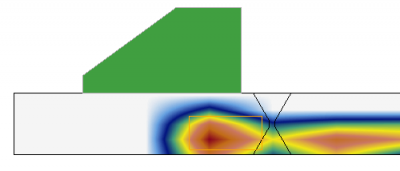
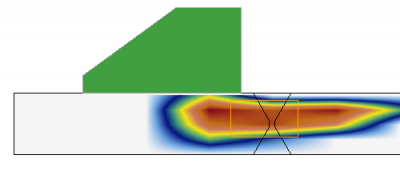
As you can see in the maps generated in Figures 2 and 3, the Sensitivity Index values are as follows:
- 41.42 for the TT wave set
- 13.89 for the TTT
- 2.18 for the LLL wave set
Referring only to the heatmaps of Figures 2 and 3, you can clearly see that the predicted coverage for the TTT wave set is insufficient in the TFM zone (the orange box) but the LLL wave set and TT wave set seem like equally good options. In both these maps, the red and orange areas provide adequate coverage of the TFM zone.
However, if you compare the Sensitivity Index readings of the TT and LLL maps (41.42 versus 2.18, respectively), you can calculate that the sensitivity of those red and orange areas are 19 times stronger in the TT wave set map than the LLL wave set map.
The higher the predicted sensitivity, the better the expected signal-to-noise ratio (SNR) for those areas in the TFM inspection.
Summary of the AIM Modeling Tool’s Advantages for TFM
TFM offers promising opportunities for industrial inspection applications, but without the proper modeling tool, it is difficult to predict the true sound wave coverage and level of sensitivity.
The OmniScan X3 flaw detector’s scan plan tool with AIM modeling enables the inspector to confirm, with confidence, which TFM mode is appropriate for the inspection.
For more information on the benefits of TFM for phased array ultrasonic inspection, read our application note “Using the Total Focusing Method to Improve Phased Array Ultrasonic Imaging.”