
Capture™ software version 3.2 brings exciting enhancements for weld inspection including a new scan plan for Phased Array Ultrasonic Testing (PAUT) and Plane Wave Imaging (PWI) inspections and Total Focusing Method (TFM). With improved productivity, multimode, and multigroup capabilities, this data acquisition and analysis software also offers some nice tools for people performing corrosion mapping inspections. This article demonstrates the added value of Eddyfi Technologies’ continuously evolving software that enables better and better corrosion mapping operations.
Corrosion mapping consists of scanning the surface of the test piece and measuring the remaining material thickness for each position. It can be done using conventional ultrasonic testing or a phased array probe. Eddyfi Technologies proposes a complete ecosystem for people who are doing corrosion mapping inspections leveraging its worldwide centers of excellence. The manual R-Scan Array, semi-automated LYNCS™, and fully automated RMS PA scanners work smoothly with our world-famous PAUT systems, Mantis™ and Gekko®. Aqualock is the universal probe among the scanners and is based on a water box concept making it easier to scan components with bad surface conditions. The ultrasound propagates through a column of water eliminating the need for a wedge, thus providing the benefits of improved signal consistency, accuracy, and limited dead zone. The following video shows several inspections made with the above-mentioned scanners and the portable Mantis inspection tool.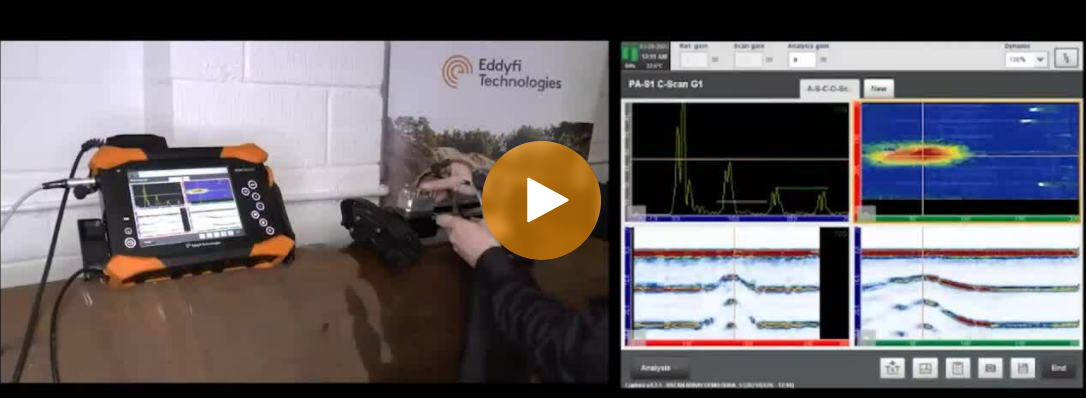
When dealing with a water box concept, there are slight variations in water column height due to the compression of the hard foam used at the front of the water box. When performing corrosion mapping, operators want to measure the remaining thickness of the component and not variations in the water column. It is thus necessary to use synchronized gates that measure the differences in time-of-flight between the backwall and the front surface echo. The difference between the first backwall echo and the second back-wall echo, both synchronized with the front surface echo, can be used when dealing with coated or painted components to remove the influence of the coating/paint in the remaining thickness measurement.
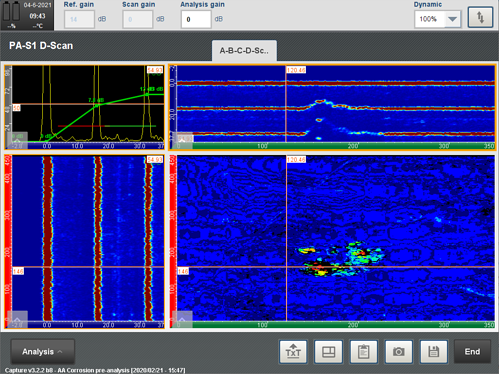
When tightening the probe in its holder, it is possible to introduce a slight tilt that makes the front surface echo not horizontally. While gate synchronization allows for thickness measurement by correcting the variations in the water column, operators may also want to correct variations in probe orientation to have a better visualization. Capture 3.2 provides straightening of the front surface echo to improve the display of corrosion mapping data. Once straight, the front surface echo, and subsequently all the backwall echoes, become flat as they are synchronized with the front surface echo. The following image shows a corrosion map obtained using the Aqualock; gate synchronization for the first back wall and second back wall echoes was used, and the front surface echo was straightened. One can see in the B-scan and D-scan images that this echo is flat as well as the backwall echoes in the areas exempt from corrosion.
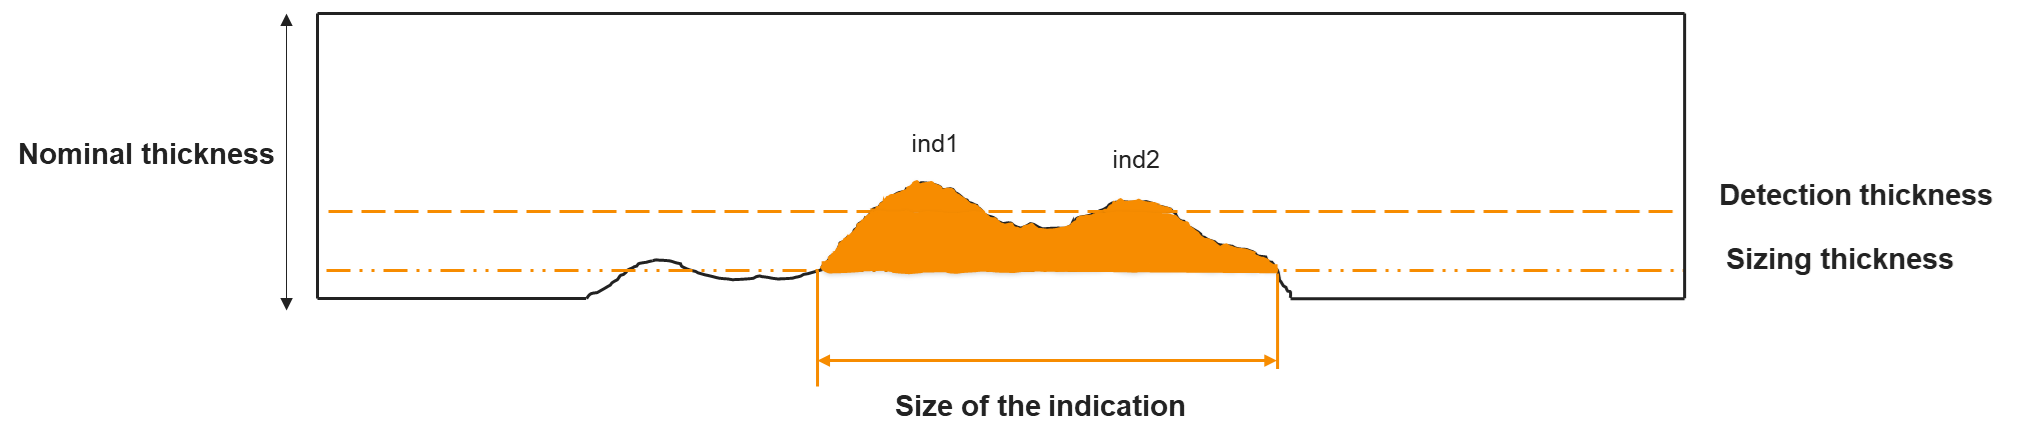
Data analysis can sometimes become the bottleneck for making a decision about the integrity of a component. Capture 3.1 offered a tool that allowed automatic sizing of the defect based on a decibel drop method. Capture 3.2 extends this tool to Corrosion Mapping Inspections. Operators need to define a thickness detection threshold above which indications are detected. For all positions in the C-scan, if the remaining thickness is below the threshold, then these points are considered corroded. A sizing threshold is then used to size the corroded areas. The algorithm looks along both directions, scanning and indexing if the neighbor pixels have a remaining thickness below the sizing threshold. If yes, then the algorithm continues to the following pixels until the sizing criterion is not respected anymore. The following image shows the concept for the auto-sizing criterion implemented in Capture 3.2.
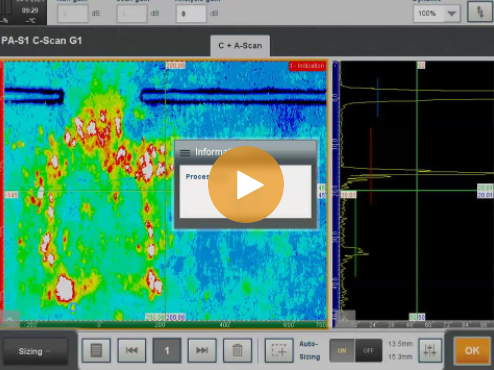
Capture automatically detects all the indications within the area corresponding to these criteria and creates a table of indications. The table is fully customizable (length, width, remaining thickness, positions, etc.) and indications can be rearranged and merged. The following video shows an example of the auto-sizing feature applied to a 1000 x 700 millimeter (39 x 28 inch) corrosion map. It takes about 30 seconds to obtain the full table of indications with all the parameters of the corroded areas, making the analysis quick and powerful.
Capture 3.2 can also merge indications. When indications are close to each other, they are probably part of the same corroded area. The operator can select them in the table of indications and click on the new “Merge” button. A new indication is created which is the union of the selected indications. The length and width are recalculated to encompass all selected indications; the minimum remaining thickness is the minimum remaining thickness of all selected indications.
If you want to improve your corrosion mapping inspection capabilities, join the many industry leaders worldwide who trust Capture software to provide precise, repeatable, and actionable data. Contact our friendly and knowledgeable experts to learn more today and stay Beyond Current.
References:
1. Eddyfi Technologies


