

Table of Content
- Abstract
- Introduction
- Related work
- Datasets acquisition and processing
- Compressive strength evaluation and visualization
- Site validation and discussion
- Conclusions
- Credit authorship contribution statement
Abstract
Evaluation of compressive strength in underground lining structures is critical for ensuring structural integrity and safety. Traditional assessment methods are often destructive, time-consuming, and impractical in confined environments such as tunnels and utility corridors. This study introduces an automated, nondestructive approach to visualize and estimate the compressive strength of underground concrete lining using hyperspectral imaging (HSI) combined with deep neural network (DNN) models. High-dimensional spectral data of concrete lining are assembled and trained to develop two DNN-based regression models, namely the Mono-Spectrum Deep Neural Regressor (MS-DNR) and the Segmented-Spectrum Deep Neural Regressor (SegS_DNR). Utilizing the SegS_DNR model, two-dimensional (2D) compressive strength distribution heatmaps were generated for visualization and assessment of strength variations. The SegS_DNR model demonstrated excellent predictive performance, achieving a coefficient of determination (R2p) of 0.925 and a Residual Prediction Deviation (RPD) of 5.28 on the testing set for compressive strength estimation. The idea is further validated in site by investigating the capability of identifying the defect regions of the tunnel concrete lining, namely the cracked, spalling, and leaking areas, and demonstrated promising performance in comparison with experienced inspectors on site. This approach offers a contact-free technique for automated structural health monitoring, contributing to safer and more sustainable underground maintenance practices.
1. Introduction
With acceleration of the urbanization and increasing utilization of the underground spaces, underground engineering projects such as subway tunnels, highway tunnels, and utility corridors have rapidly developed worldwide (No and Association, 2000; Li et al., 2015; Huang et al., 2022; Xia et al., 2022; Yu et al., 2023). Concrete structures are widely adopted in these underground settings due to their cost-effectiveness and stability (Putra, 2021; Antoniou et al., 2023; Wei et al., 2025). As a key indicator of structural performance, the compressive strength of concrete is susceptible to deterioration under complex underground conditions, such as water seepage (Huang et al., 2020; Wang, 2021) and stress concentration (Boulekbache et al., 2012). Such deterioration, if unaddressed, can compromise the structural integrity and may lead to catastrophic failures such as tunnel collapses (Huang et al., 2024b; Zhang et al., 2024c; Wang et al., 2025). Thus, the automated and nondestructive assessment of compressive strength is critical for informed lifecycle management and maintenance decisions in underground infrastructures (Zhao et al., 2021b, 2023; Zhou et al., 2021; Du et al., 2023), aiming to ensure operational safety and prevent such failures.
Conventional destructive methods for compressive strength evaluation of concrete lining, including coring and pull-off testing, are often impractical in confined underground environments, as they may damage the structure and require considerable time and labor (Ebead and Younis, 2019; Ali-Benyahia et al., 2023). Nondestructive testing (NDT) methods have therefore become essential in civil infrastructure maintenance and inspection (Pucinotti, 2015; Rashid and Waqas, 2017; Wang et al., 2023a; Zhang et al., 2024a, 2024d). Hyperspectral imaging (HSI) has recently emerged as a promising NDT approach, offering high spatial and spectral resolution to capture detailed reflectance characteristics of materials (Ptacek et al., 2021; Song et al., 2023; Huang et al., 2024a). However, the high dimensionality and complexity of HSI data impose greater demands on data processing and analysis, necessitating the integration of advanced analytical techniques and models to fully exploit its latent information. This study aims to develop an innovative NDT method for concrete compressive strength by integrating HSI with deep learning (DL). Additionally, it seeks to achieve visualization of the strength distribution and analyze the characteristics of structural strength degradation. Compared to existing methods, the main contributions of this study are as follows:
- Apply HSI technology to the NDT of concrete compressive strength. By capturing the reflective properties of concrete across multiple spectral bands, it extracts rich spectral and spatial information to achieve high-precision predictions of concrete compressive strength.
- Develop spatial distribution mapping techniques for compressive strength. These techniques can intuitively display the distribution of compressive strength across different regions of concrete structures, aiding in identification of the potential weak points and damaged areas.
- Obtain visualized strength results and degradation characteristics in typical defect and damage areas within concrete structures. This not only verifies the practicality and reliability of the methods but also provides strong support for their application in real-world engineering projects.
To gain a comprehensive understanding of the existing methods for testing the compressive strength of concrete structures and their limitations, Table 1 categorizes and summarizes traditional destructive testing methods, current NDT methods, and machine learning (ML) prediction methods. As shown in Table 1, destructive testing approaches, while capable of delivering precise data, exhibit strong invasiveness, potentially harming existing structures, and are time-consuming and laborious. For example, core extraction testing requires drilling cylindrical samples from the concrete structure, damaging the structure, and conducting tests in laboratory (Saleh et al., 2022; Xu and Li, 2018). Conversely, pull-out testing is used to measure the surface adhesion of concrete, indirectly reflecting compressive strength; however, its results are influenced by various factors, including aggregate properties, the location of rebar, and procedural variations, and its accuracy is relatively limited (Ramos et al., 2012).
NDT provides safer alternatives for concrete compressive strength assessment. Common methods like ultrasonic testing, GPR and rebound hammer employ distinct physical principles: ultrasonic waves detect internal propagation patterns (Komloset al., 1996; Del Rıo et al., 2004), GPR uses electromagnetic waves for defect identification (Lai et al., 2009; Tosti and Ferrante, 2020), while rebound hammers measure surface hardness. However, these methods face inherent limitations, as ultrasonic accuracy depends on material homogeneity, GPR suffers from resolution-depth tradeoffs, and rebound hammers are prone to surface/environmental interference. Crucially, none can generate spatial visualization of strength distribution or precisely characterize structural degradation in complex underground environments. This highlights the need for advanced visualization technologies to enable automated, precise strength assessment in underground concrete structures.
HSI, as an advanced NDT technology, has garnered widespread attention in the inspection of concrete structures in recent years. As illustrated in Fig. 1, HSI captures the reflective properties of materials across multiple continuous spectral bands, providing rich spectral and spatial information that enables in-depth analysis of the chemical composition and physical state of concrete (Short et al., 2001; Bonifazi et al., 2018; Kim and Cho, 2018). Compared to traditional NDT methods, HSI boasts high spatial and spectral resolution, enabling the capture of detailed spectral information on the concrete surface at a microscopic level, which aids in identifying minute changes and defects within the material (Song et al., 2023). For example, hyperspectral technology can evaluate and identify concrete properties in various structural components through the reflected radiation of concrete in the visible-near infrared and short wave infrared (VI-NIR and SWIR) (Shaban, 2013; Oliveira Santos et al., 2019). Additionally, the non-invasive nature of HSI makes it an ideal tool for real-time monitoring at construction sites, as it does not cause any physical damage to the concrete structures. Furthermore, HSI can estimate the physicomechanical properties of concrete through qualitative analysis of material composition. By integrating chemical analysis methods, HSI can identify and quantify the distribution and content of components such as cement, moisture, and rebar, thereby inferring the trends in compressive strength variations (Bonifazi et al., 2018; Ptacek et al., 2021). However, application of the HSI to detection of the compressive strength of concrete structures also faces challenges, as most current research remains confined to laboratory testing and is difficult to apply in complex engineering projects. Thus, the challenge is how to efficiently handle and analyze HSI data, fully utilize its rich information and visual technologies, and perform machine vision-based assessments of compressive strength within engineering structures.
Table 1
Research methods for concrete compressive strength detection.
Method | Testing | Strength | Limitation | Source |
|---|---|---|---|---|
Traditional destructive testing method | Core sampling Pull-off test | Providing accurate compressive strength data Providing accurate compressive strength data compressive strength | Highly invasive, may damage structures, time-consuming and labor-intensive Affected by multiple factors, limited accuracy | Saleh et al. (2022), Xu and Li (2018) Ramos et al. (2012) |
Current NDT method | Ultrasonic testing Ground penetrating radar (GPR) Rebound hammer test | Assessing internal state and compressive strength Detecting internal defects and structural characteristics Estimating surface compressive strength | Highly affected by material uniformity and construction quality Limited resolution and difficult to visualize compressive strength Low accuracy, affected by surface treatment | Komlos et al. (1996) Lai et al. (2009) Alwash et al. (2017) |
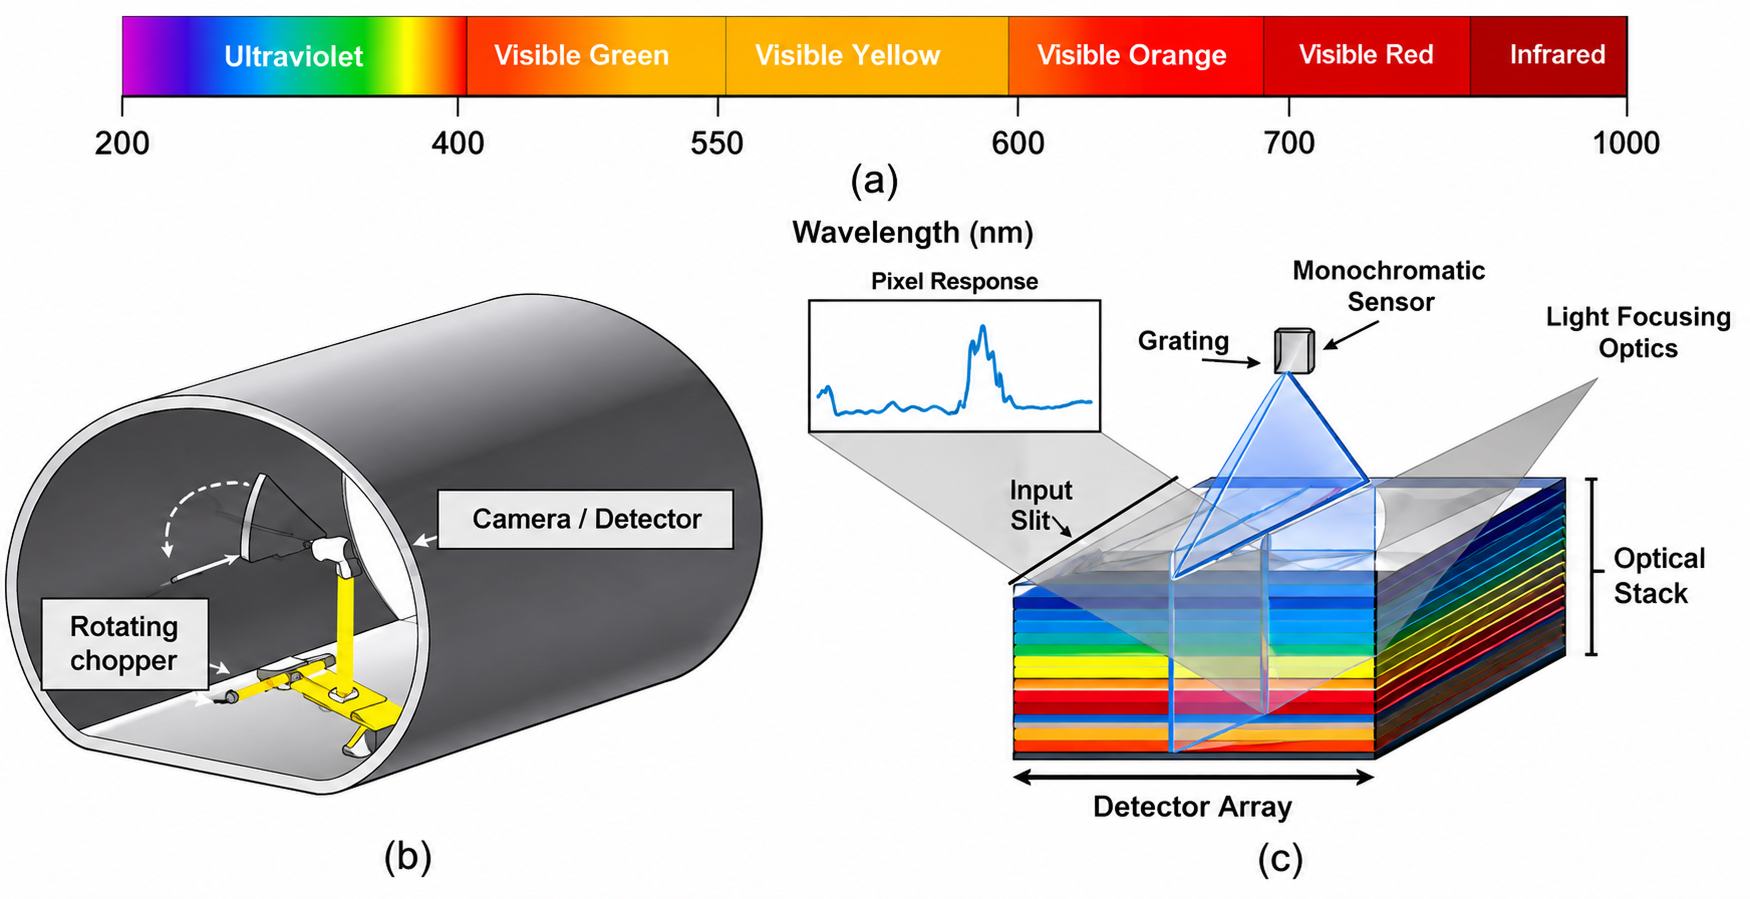
Fig. 1. The operating principle of hyperspectral imaging: (a) Spectral wavelength classification, (b) scanning equipment, and (c) hyperspectral data structure.
With advancement of computational capabilities and development of big data technologies, application of ML and DL methods in NDT has been increasingly widespread, particularly demonstrating significant potential in predicting the compressive strength of concrete (Günaydın et al., 2023; Phoon and Zhang, 2023; Alavi et al., 2024; Buddika et al., 2024). Beyond strength prediction, DL techniques, especially Convolutional Neural Networks (CNNs), are also being successfully applied for automated detection and quantification of various structural defects in tunnels, such as water leakage and cracks (Zhao et al., 2021a; Zhang et al., 2022; Ma et al., 2025a, 2025b). These methods leverage various types of data, including concrete mix proportions, physicochemical properties, environmental conditions, and sensor acquired data, enabling automatic feature extraction and capturing complex nonlinear relationships within concrete materials, thereby enhancing the accuracy and reliability of predictions. Traditional ML algorithms, such as Support Vector Machines (SVM), Random Forests (RF), and K-Nearest Neighbors (KNN), have been widely applied in prediction of the concrete compressive strength (Chun et al., 2020; Chen et al., 2021; Li et al., 2022; Zhang et al., 2024b). In recent years, DL methods, particularly CNNs and deep neural networks (DNNs) have demonstrated higher accuracy and robustness in predicting concrete compressive strength, owing to their powerful automatic feature extraction capabilities and advantages in handling high-dimensional data (Zhao and Du, 2016; Zhong et al., 2017; Wang et al., 2023b). These models are capable of automatically learning meaningful features from complex input data, thereby reducing the dependence on manual feature engineering (Deng et al., 2018; Zeng et al., 2022; Zhang et al., 2025).
Through above innovative works, this study fills the research gap in application of the HSI for concrete compressive strength detection and visualization. It provides an automated, nondestructive visual detection technology, offering new technical means and theoretical foundations for the maintenance and life-cycle management of underground infrastructure.
3. Datasets acquisition and processing
In this study, hyperspectral datasets from in situ tunnel concrete linings were obtained, and various DL algorithms were developed to identify compressive strength. The performance of these models was compared and analyzed. Finally, the constructed DL models were applied in engineering practice to validate their effectiveness.
3.1. Compressive strength and spectral data acquisition
In this study, data are collected from two sections: the Shanghai Metro Line 12 and the Qingdao Metro Line 8, as illustrated in Fig. 2b. Both are operational metro tunnels constructed using slurry shield tunnelling methods with prefabricated reinforced concrete segmental linings, with a design concrete strength grade of C55. The former crosses the Huangpu River, primarily traversing soft alluvial and marine deposits typical of the region (e.g. layers of clay, silty clay, and sand). The latter traverses Jiaozhou Bay, encountering challenging geological conditions including marine sediments, weathered rock, and fault fracture zones. Groundwater and complex weak strata in these subaqueous environments contribute to concrete challenging issues for lining such as water leakage, spalling, and cracking, which poses significant risks to metro operations and public safety. The long-term operational exposure to these challenging environments, coupled with factors like numerous segment joints, potential installation stresses, and gradual material degradation, can still lead to the occurrence of such defects over elapsed time, necessitating reliable condition assessment.
An information acquisition system is developed to scan and obtain high-quality hyperspectral images of underground concrete structures, as shown in Fig. 2a. The hyperspectral image acquisition system primarily consists of a hyperspectral camera, tripod, halogen light source, computer, reflectance calibration plate, and rebound hammer. The chosen hyperspectral camera, a domestically developed pushbroom near-infrared imaging spectrometer, model FigSpec FS-27 (Hangzhou CHNSpec Technology Co., Ltd., Hangzhou, China), employing an InGaAs sensor, captures 1280 × 1280 pixels spectral images within the 900–1700 nm spectral range (1024 bands, 6.5 nm spectral resolution) and saves them as 1024-bit hyperspectral image cubes. The illumination is provided by a halogen light source (FG-1000W, 400–1700 nm), offering a full-spectrum light source. The hyperspectral camera is mounted on a tripod and connected to the acquisition software terminal via a data cable, which is used to set camera parameters and capture hyperspectral images. A standard reflectance plate is placed above the detection area to facilitate reflectance calibration of the hyperspectral images. This calibration plate has been calibrated in the laboratory to a known reflectivity curve.
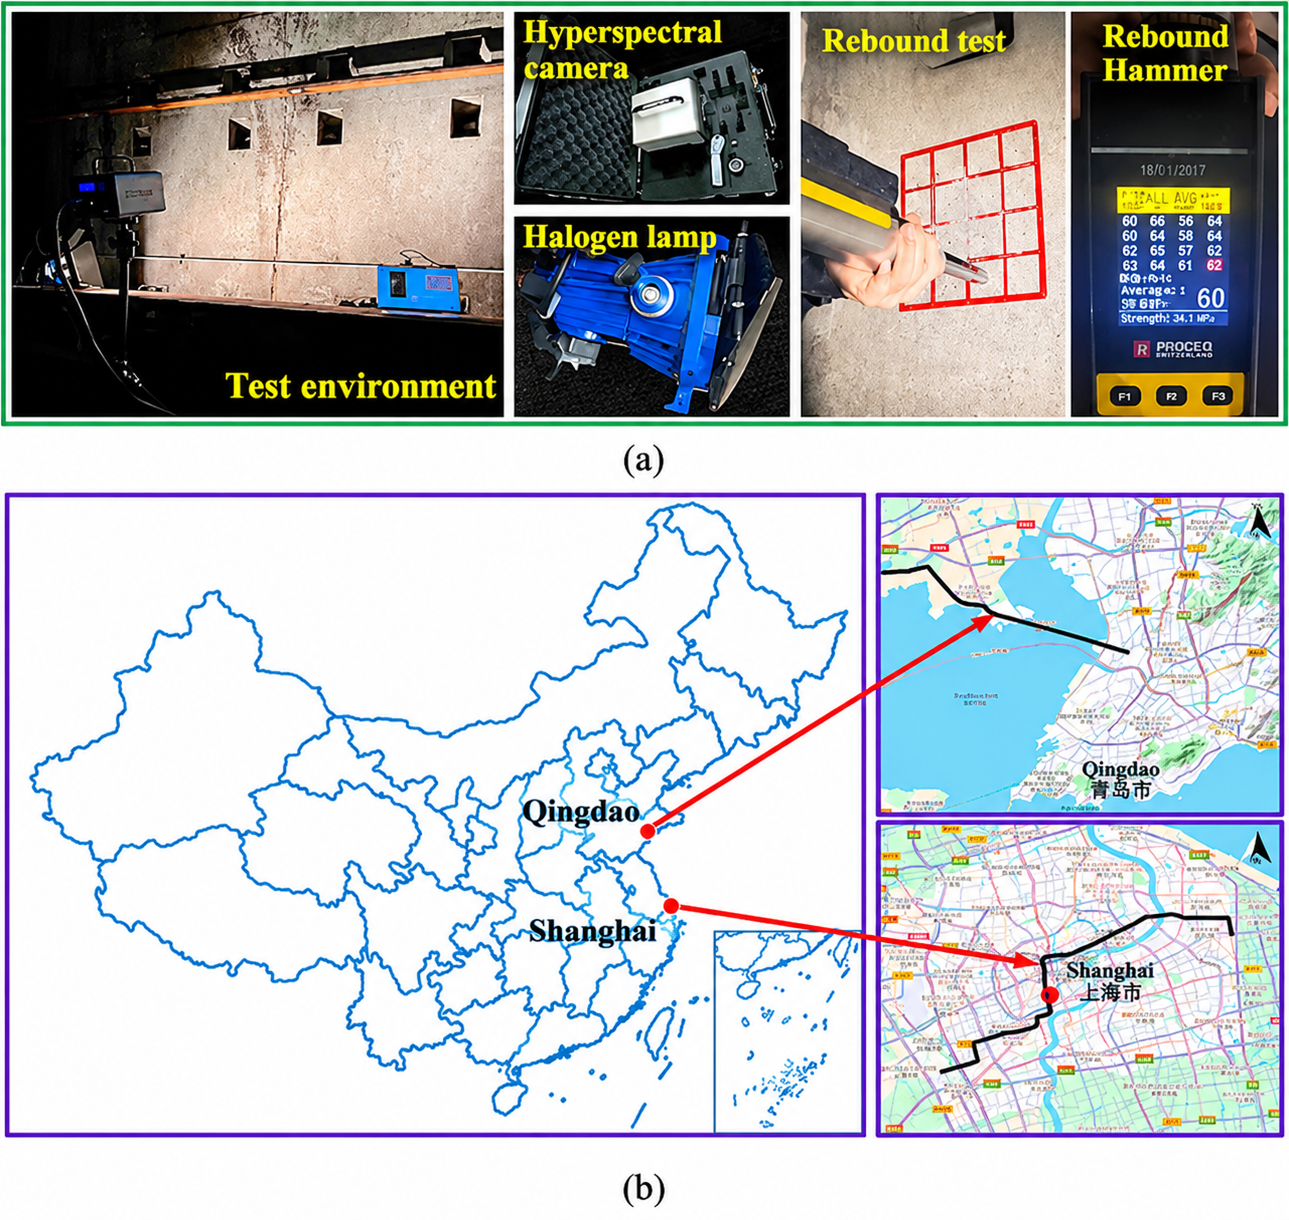
Fig. 2. Geographical location and sampling environment of the study area: (a) Schematic diagram of data collection, and (b) map of the study area’s geographical location.
To ensure high-quality and consistent HSI of the tunnel linings, the camera distance and exposure time are adjusted based on the calibration plate readings before the formal image capture. Adjustments continue until the detected reflected light intensity from the plate reaches approximately 60 % of the saturation level. This target helps to optimize the signal-to-noise ratio and ensure measurements are made within the linear response range of the sensor, thereby stabilizing the data against minor illumination fluctuations and preventing data-deficient pixels caused by insufficient or excessive illumination. This 60 % target was monitored by observing the peak raw digital number (DN) values which are directly proportional to the light intensity received by the sensor elements—from the white reflectance plate in the live data feed provided by the camera’s acquisition software. This ensures that the signal is strong yet well below the sensor’s saturation limit (the FigSpec FS-27 employs a 12-bit sensor, with a maximum DN of 4095, thus the target was approximately 2457 DN).
As illustrated in Fig. 2a, a high-precision digital rebound hammer (Model HT225T, ZBLScien Technology Co., Ltd., Beijing, China), featuring direct digital display of rebound values, estimated strength, and compliance with C805/C805M-13a (2013), is employed in situ to determine the compressive strength of the tunnel lining surface. The measurement points were strategically distributed along the tunnel’s longitudinal axis at 5-m intervals, covering critical structural zones (e.g. vault, sidewalls, and invert) and diverse surface conditions, including intact areas, cracks, spalling, and water seepage regions, to characterize the lining’s mechanical behavior under varying states. The points were selected using a standard 4 × 4 grid arrangement combined with the following criteria: (1) prioritizing representative coverage of both normal and deteriorated surface conditions, and (2) introducing one random validation point between every ten primary grid points for cross-verification of data consistency. This hybrid approach ensured systematic coverage of the surveyed area while capturing the heterogeneity of tunnel lining performance. While hyperspectral images of the tunnel surface were acquired, rebound values were simultaneously recorded at each designated sampling point. To account for the influence of carbonation on the surface properties, three additional random points were chosen within the measurement region to quantify carbonation depth. The average of these three measurements, denoted as dm, was adopted as the representative carbonation depth for the site.
According to C805/C805M-13a (2013), the following equation is applied to convert the raw rebound measurements into standardized compressive strength values:

where fic represents the converted compressive strength at the i-th measurement point (MPa), Ri is the rebound value at that point, and dm is the measured carbonation depth (mm).
3.2. Compressive strength datasets analysis
As illustrated in Fig. 2a, rebound values are obtained from 108 measurement points in underwater tunnel concrete linings located in Shanghai and Qingdao using a rebound hammer. Simultaneously, the carbonation depth of the tested areas was measured, and the corresponding compressive strength values were calculated using Eq. (1). Statistical parameters such as the mean (MEAN), maximum (MAX), minimum (MIN), standard deviation (SD), and coefficient of variation (CV) were computed for the dataset. The normal distribution P-Q (probability-quantile) plot of the compressive strength data is presented in Fig. 3. Most data points lie within the 95 % confidence interval of the normal distribution, and the CV is approximately 0.06. These results indicate low variability and a good fit with normal distribution properties, suggesting that the dataset is well-suited for regression analysis.
To assess whether the sample size is sufficient to represent the strength distribution of the examined area, the formula for calculating the minimum sample size is provided in Eq. (2), grounded in statistical power principles (Cohen, 1992):

where N represents the minimum sample size required, z is the value from the standard normal distribution corresponding to the desired confidence level, σ x is the estimated standard deviation of the population, and ME is the required margin of error.
With a 95 % confidence level, when z = 1.96 and ME = ±1 MPa, the SD of the compressive strength datasets is measured at 3.45 MPa. Thus, the calculated minimum sample size n is 45.72, affirming that the 108 measurement points of compressive strength values are sufficient for this study.
3.3. Hyperspectral calibration and pre-processing
Reliable strength estimation from hyperspectral data demands that the raw spectral signals be systematically corrected and enhanced. Prior to feature extraction, the raw hyperspectral images were calibrated to remove sensor-related noise and illumination inconsistencies. This involved comparing the raw intensity (SIRaw) against a white reference (SIWhite) and a dark current measurement (SIdc). The calibrated reflectance (Rcalibrated) was computed by
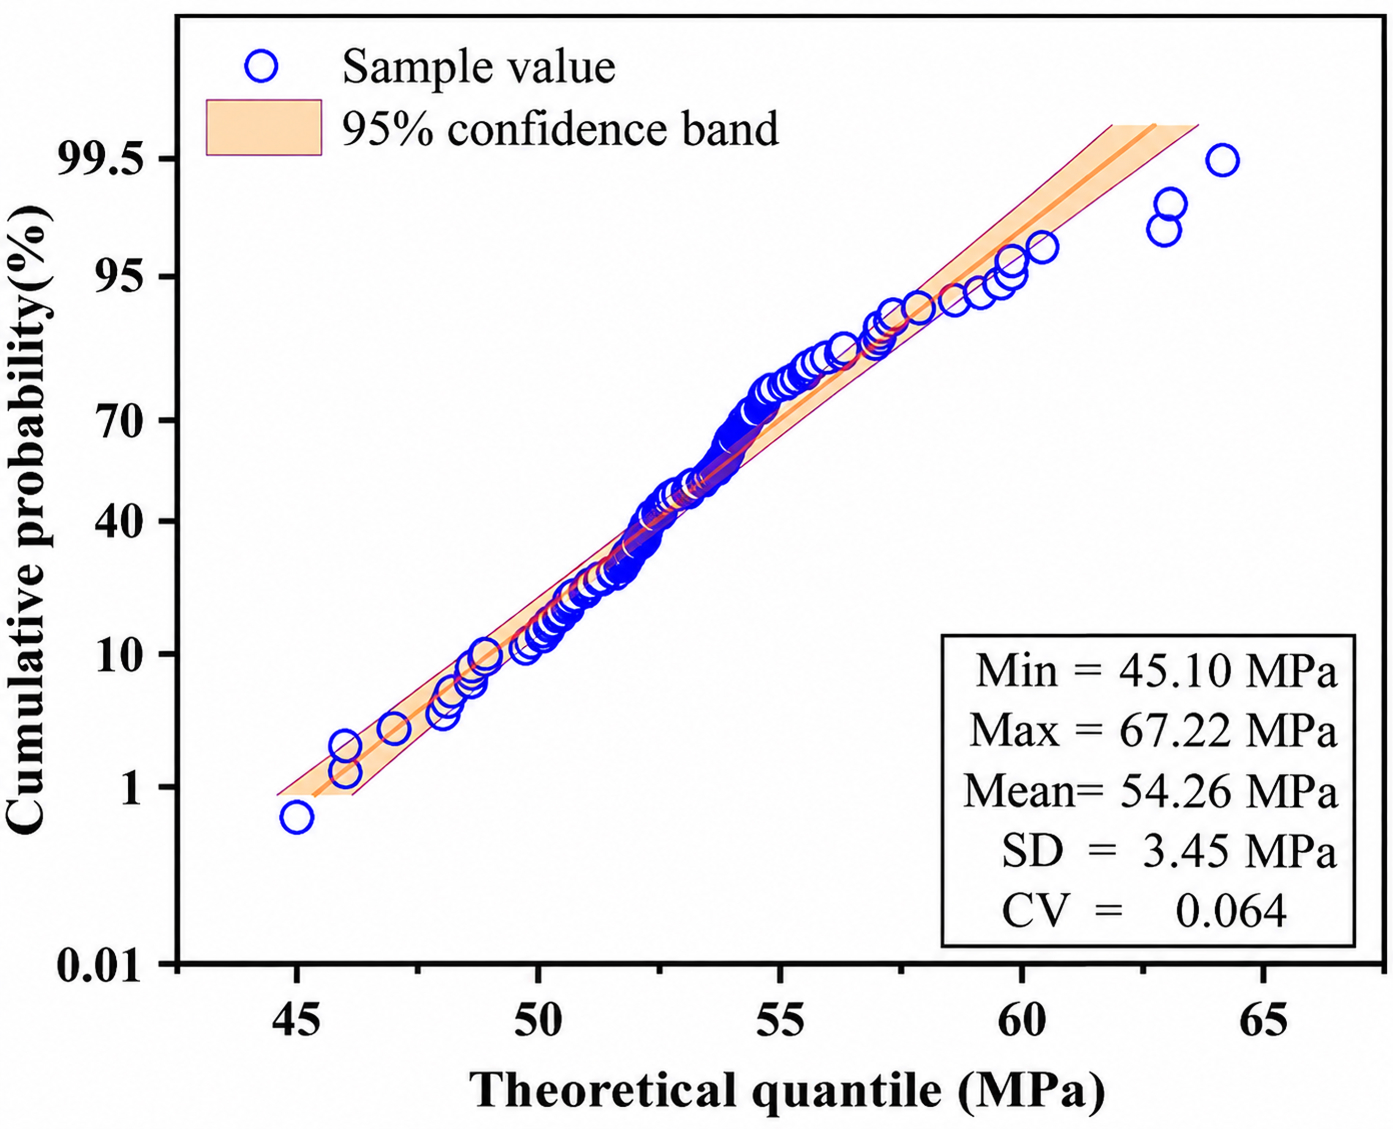
Fig. 3. Normal distribution P-Q diagram of the compressive strength test dataset.

where RWhite (λ) is the standard reflectance spectrum of the white board. After calibration, pixel-wise reflectance spectra were extracted using ENVI software for subsequent analyses.
Next, to increase the sensitivity of the dataset to fine-grained spectral features relevant to concrete strength, a first-derivative transformation was applied. This derivative operation emphasizes subtle spectral variations, diminishes baseline shifts, and enhances the resolution of overlapping spectral features (Roy, 2015). Formally, for a given wavelength λi, we have

By performing this sequence of steps-calibration to remove extraneous noise and first-derivative processing to highlight informative spectral cues, the resultant spectral dataset is better poised to serve as input for regressor-based strength prediction models.
3.4. Spectral characteristics analysis
3.4.1. Spectral reflectance characteristics of typical regions
To investigate the compressive strength degradation characteristics of typical regions in tunnel linings, hyperspectral reflectance measurements were performed for spalling, leakage, and crack areas. Five measurement points (A–E) were selected in each region to capture the spectral differences within and outside the affected areas. The spectral reflectance characteristics at these points are analyzed to establish the relationship between reflectance and strength degradation, providing a basis for visual strength identification.
As shown in Fig. 4, the spectral reflectance characteristics of the spalling region exhibit clear differences between points inside and outside the spalled area. Points B and C are located within the spalled area, while points A, D, and E are outside it. The reflectance values at points B and C are significantly lower than those of points A, D, and E across the wavelength range of 900–1700 nm. This indicates distinct surface characteristics in the spalled area compared to the intact regions. The reduced reflectance in the spalled area (Points B and C, Fig. 4b) may be attributed to increased surface roughness, reduced material density, and micro-crack development, which enhances light scattering away from the sensor. Beyond these physical changes, alterations in cement hydration products due to weathering or localized chemical attack in the exposed spall could subtly influence the NIR spectrum; for example, changes in the proportion or nature of O-H containing phases might manifest as broad, subtle shifts. Indeed, the slight increase in reflectance beyond 1600 nm in some spalled areas may indicate secondary mineral deposits or residual moisture on the surface, which further contribute to strength degradation in this region.
Fig. 5 presents the spectral reflectance characteristics of the leakage region, which shows significant spatial variation. Points B and C, located in the leakage core area, exhibit higher reflectance values than points A, D, and E. This is particularly evident near 1400 nm, where prominent water absorption features indicate high free moisture content. In addition to free water, prolonged exposure to moisture can accelerate leaching of soluble cement hydration products like Ca(OH)2 or promote sulphate reactions if sulphates are present, potentially altering the baseline and subtle O-H related absorption features throughout the 900–1700 nm range due to changes in the mineralogical composition of the hydrated paste. The increased moisture content itself, indicated by the strong 1400 nm band, significantly weakens the cohesion and bonding strength of the material (Hover, 2011; Shoukry et al., 2011). Conversely, points A and E, located farther from the leakage core, exhibit lower reflectance values, indicating relatively dry and less deteriorated surfaces. The spatial distribution of reflectance in the leakage region highlights the influence of moisture on compressive strength degradation, with strength deterioration decreasing progressively from the center outward.
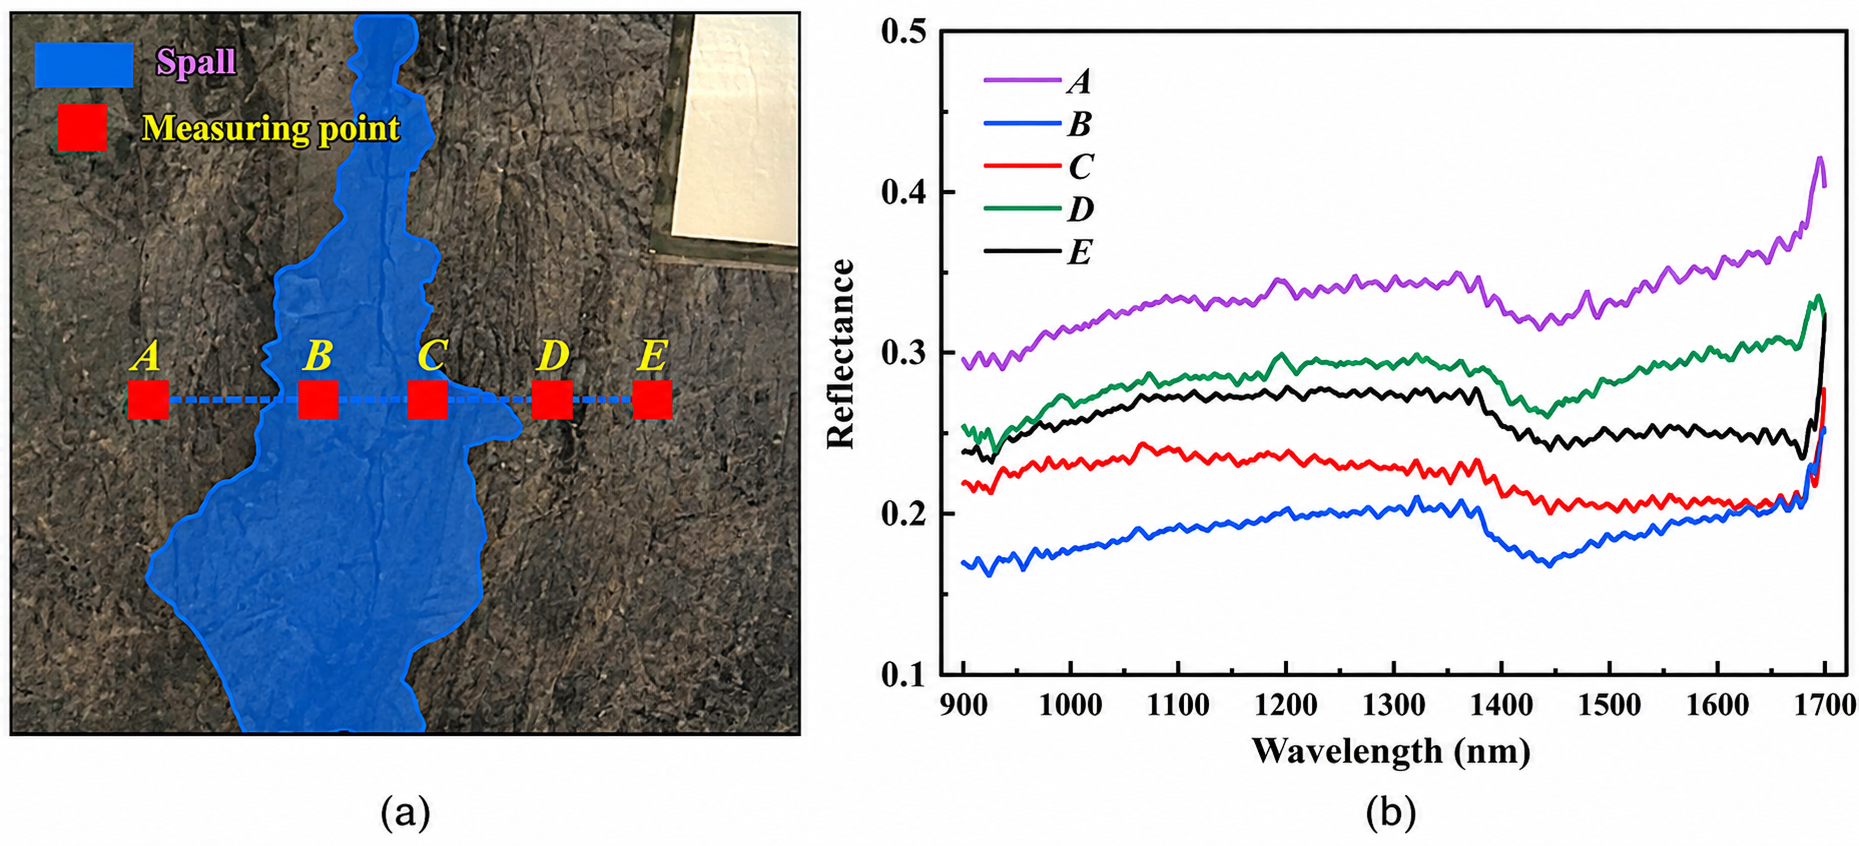
Fig. 4. Spectral reflectance characteristics of the spalling region: (a) Measurement point distribution, and (b) spectral reflectance curves of measurement points A–E.
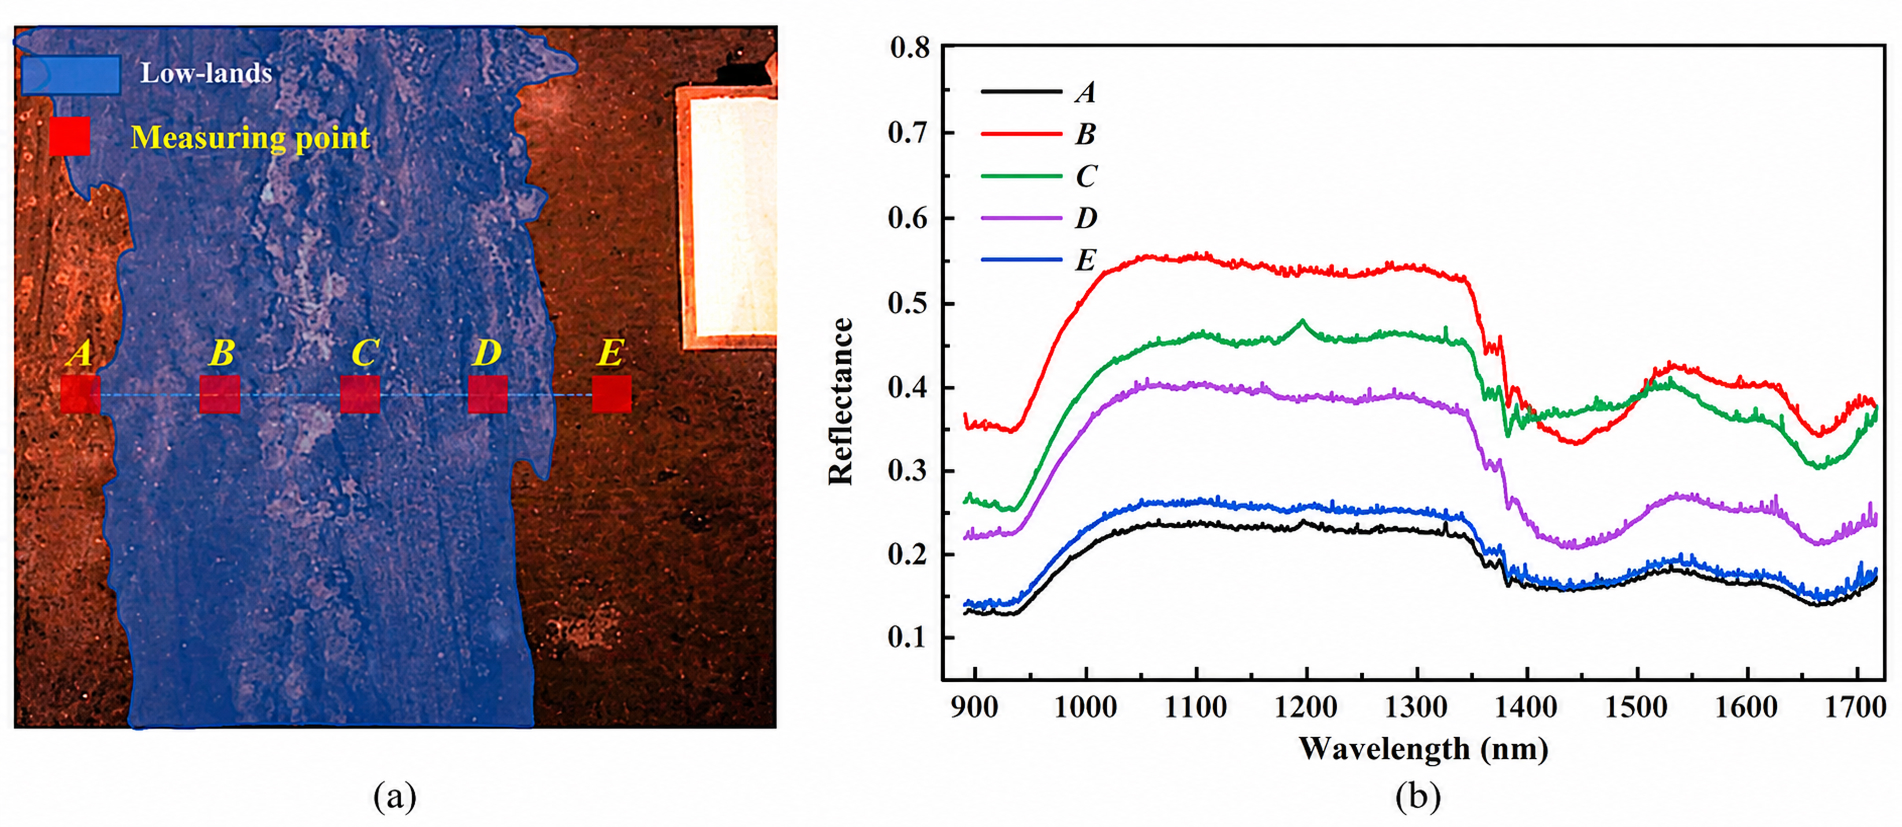
Fig. 5. Spectral reflectance characteristics of the leakage region: (a) Measurement point distribution, and (b) spectral reflectance curves of measurement points A–E.
The spectral reflectance characteristics of the crack region (Fig. 6) show notable variations linked to measurement proximity to the crack and intersecting structural features. Fig. 6a reveals a rough-joint intersecting the main crack in the central area. Points C and D, located within or directly adjacent to this crack-joint intersection—an area of more severe localized degradation—consistently exhibit the lowest reflectance values (Fig. 6b). This is attributed to increased light absorption/scattering within voids, debris, potential moisture, and significant material disruption. Point C’s distinct dip around 1000 nm relates to localized shadowing or specific exposed materials within this intersection. Conversely, point B shows the highest overall reflectance (Fig. 6b). Its location (Fig. 6a) is on the concrete surface peripherally affected by the crack but outside the primary opening and the crack-joint intersection. Points A and E are similarly situated outside this central compromised zone, on less severely affected parts of the segment body. Consequently, the spectra of points A, B, and E are relatively higher and comparable, indicating less structural disruption than at the crack-joint core.
These observations highlight the high sensitivity of spectral reflectance in cracked regions to precise local conditions and interactions with features like joints. The significantly lower reflectance at points C and D within the most damaged area aligns with expectations for severe strength degradation.
The spectral reflectance characteristics of the three typical regions exhibit significant differences that correspond to their unique strength degradation patterns. The spalling region shows lower reflectance within the affected area (points B and C in Fig. 4), reflecting reduced material density and increased micro cracking. The leakage region demonstrates higher reflectance in the core area (points B and C in Fig. 5) due to moisture content, highlighting its weakening effect on material strength. The crack region exhibits the lowest reflectance within its most severely disrupted core, particularly at the intersection with structural features (points C and D in Fig. 6), indicating severe structural disruption and compressive strength loss. These spectral variations, reflecting both physical changes and subtle shifts in chemo-mineralogical features related to moisture and hydration product alterations, provide a reliable basis for characterizing and quantifying strength degradation in tunnel linings, demonstrating the potential of hyperspectral data for visual strength identification.
It is important to note that while these observed spectral variations clearly differentiate defect types and correlate with strength degradation, precisely attributing subtle NIR spectral features in concrete to specific mineralogical phases (e.g. individual cement hydration products or specific secondary alteration minerals) is inherently complex. Concrete’s heterogeneous nature and the typically broad, overlapping NIR absorption bands from its many constituents mean that this study focused on the diagnostic power of overall spectral patterns and their derivatives for strength estimation, rather than detailed deconvolution of individual mineral signatures. A more granular chemo-mineralogical interpretation would necessitate further targeted research.
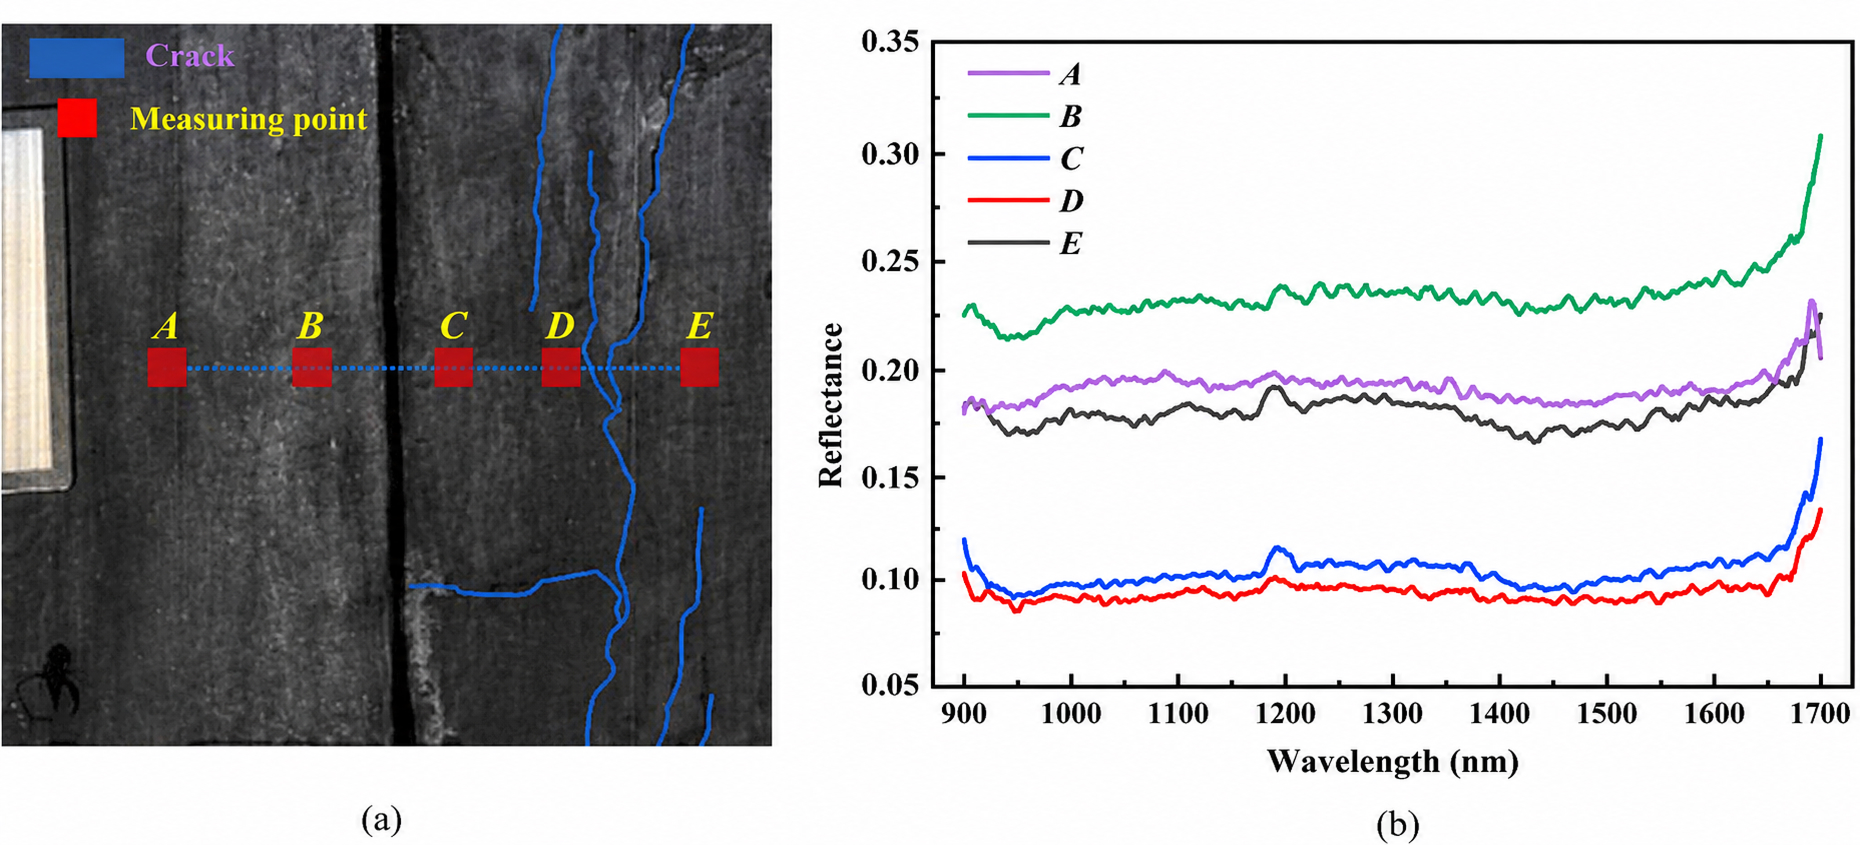
Fig. 6. Spectral reflectance characteristics of the crack region: (a) Measurement point distribution, and (b) spectral reflectance curves of measurement points A–E.
3.4.2. Spectral correlation analysis
Many studies estimate parameters by analyzing the correlation between spectral feature bands and predicted parameters (Cohen et al., 2009). In this study, we evaluated the Pearson correlation coefficients between both the original and first-derivative spectral images of concrete linings and their compressive strength, utilizing single-band and band-ratio methods. For the single-band analysis, Pearson correlations were computed between compressive strength and each of the 1024 acquired spectral bands for both original and first-derivative spectra. The coefficient ranges from 1 to 1, where positive values indicate positive correlations and negative values indicate negative correlations. The absolute value of the coefficient represents the strength of the correlation, with values closer to 1 denoting stronger relationship. The formula for the Pearson correlation coefficient is as follows:
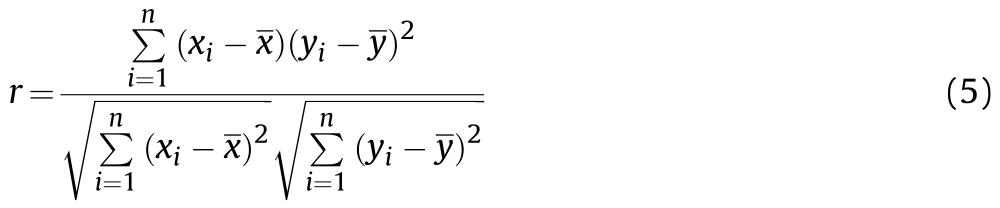
where n is the sample size; xi and yi represent individual sample points; and xi, yi are the respective sample means.
As depicted in Fig. 7, while the correlation coefficients between the first-derivative single-band reflectance and compressive strength have marginally improved over the original spectra, all correlation coefficients are below 0.3, indicating weak correlations. The heat map of the band-ratio correlations shows that the primary high-correlation bands are around 1000–1300 nm and 1400–1500 nm, suggesting consistent absorption and reflection characteristics of the cement-based materials in these bands. Given this, using specific spectral reflectance features for estimating compressive strength is unlikely to meet precision requirements.
4. Compressive strength evaluation and visualization
In this study, the Mono-Spectrum Deep Neural Regressor (MS_DNR) and Segmented-Spectrum Deep Neural Regressor (SegS_DNR) models based on hyperspectral imagery were developed to evaluate the compressive strength of underground concrete structures. Their performance was compared against two benchmark methods: the linear Partial Least Squares Regressor (PLSR) model and the nonlinear Random Forest Regressor (RFR) model. The subsequent sections provide detailed information on the parameters and architectures of the RFR model and the two proposed DL models.
4.1. DNN-based model for handling 2D spectral data
4.1.1. DNN for pixel level prediction
DNNs excel at feature extraction and demonstrate outstanding performance in nonlinear regression tasks for high-dimensional data (Saha and Manickavasagan, 2021). Their ability to model complex nonlinear mappings renders them particularly effective for parameter estimation from hyperspectral images (Niu et al., 2021). However, the construction of multiple nonlinear hidden layers in DNNs can exacerbate overfitting and weaken generalization. To address these challenges, this study proposes a DNN-based regressor (DNNR) architecture that incorporates a residual block within the hidden layers. By computing and back-propagating the error between the network’s output and the true labels through each neuron layer, this design adjusts neuron weights and biases more effectively. As a result, it helps mitigate the issues of gradient vanishing and explosion commonly associated with deep network architectures, ultimately enhancing model robustness and accuracy.
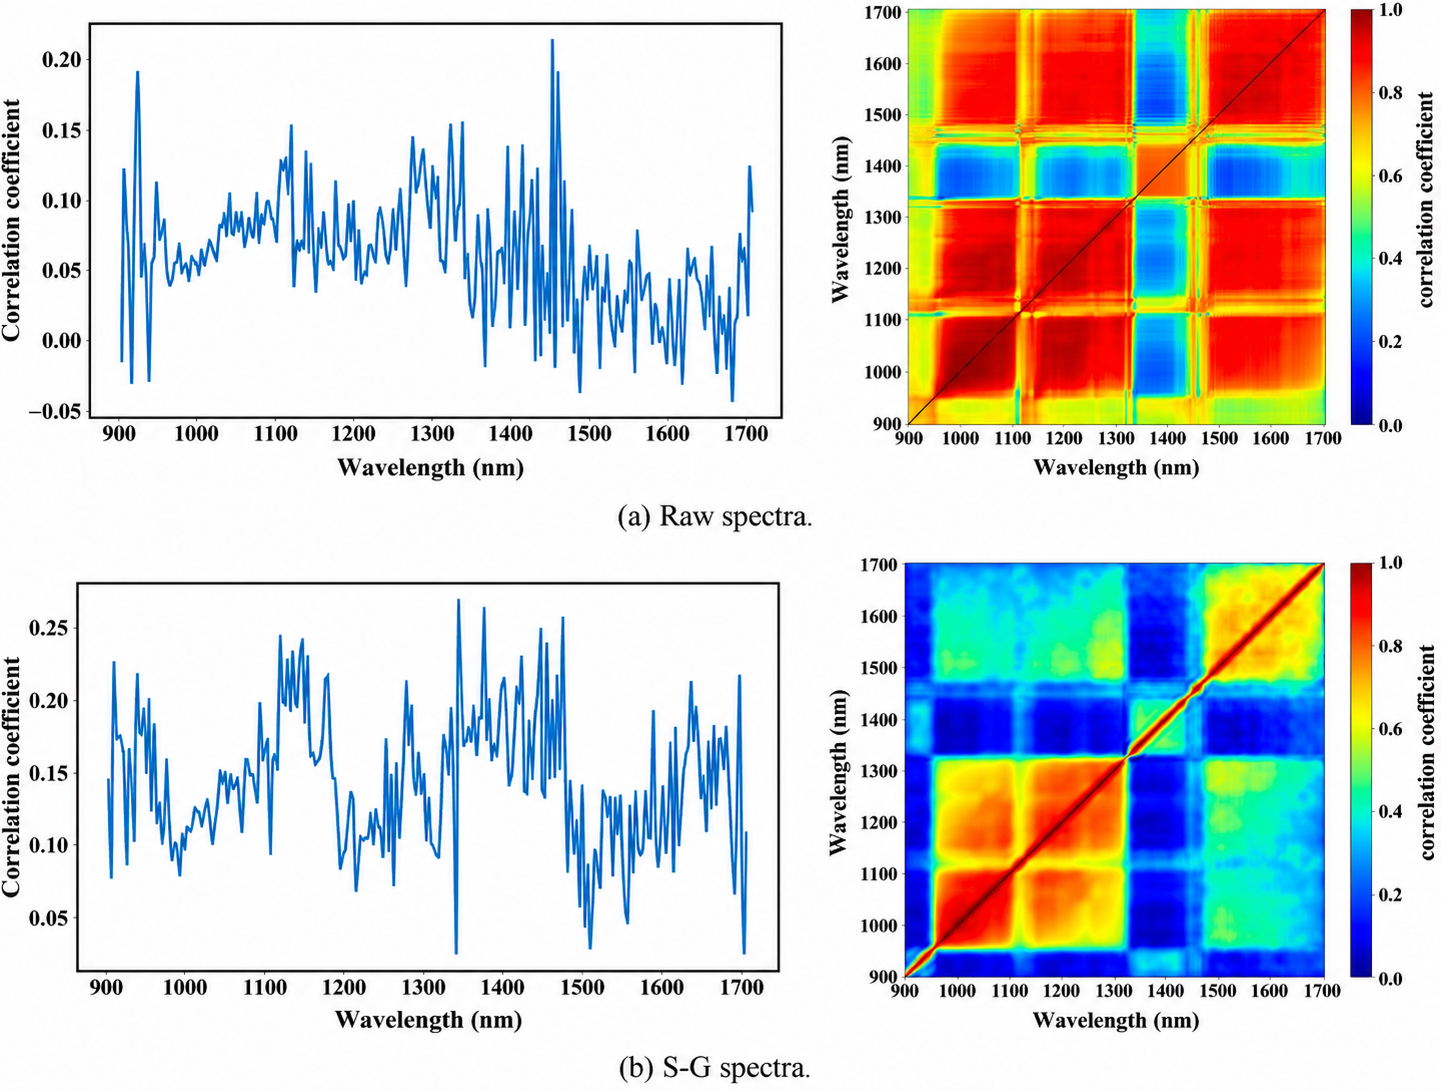
Fig. 7. Correlation patterns between individual spectral bands and corresponding band ratios: (a) Raw spectra, and (b) pre-processing.
In this study, an MS_DNR model with five hidden layers was developed, incorporating a Rectified Linear Unit (ReLU) activation function, a batch normalization unit, and a dropout unit within an enhanced residual block. This architecture processes mono-pixel, high-dimensional spectral data as inputs. For training the MS_DNR model, each rebound test value was paired with a representative spectrum extracted from the HSI data. This was achieved by identifying the rebound test location in the hyper-spectral image and averaging the spectra from a small 5 mm × 5 mm area pixel window centered on that point. This mean spectrum, reflecting local surface characteristics, served as the model input. Without normalization, the data propagated through the layers could expand or contract excessively, potentially causing gradient explosion or dissipation during back-propagation. By applying batch normalization, the input of each neuron layer is maintained within a standardized distribution, thereby improving the model’s generalization. In addition, the implemented dropout layer randomly omits outputs from the preceding layer and suspends corresponding weight and bias updates in the backward pass. This approach further enhances generalization and reduces overfitting. The learning rate and number of epochs, along with other hyperparameters, were determined through 5-fold cross-validation performed on the training portion of the dataset for hyperparameter optimization, with optimal values set to 0.01 and 800, respectively. The MS_DNR architecture is illustrated in Fig. 8a.
4.1.2. DNN for image scale prediction
Hyperspectral images of concrete structures not only capture the high-dimensional spectral characteristics of individual pixels but also encompass complex and heterogeneous spatial features (Zhang et al., 2016). Although the MS_DNR model processes isolated pixel-level spectral signatures, it omits the spatial information available in hyperspectral images, potentially affecting regression accuracy. To address this, we developed a SegS_DNR that processes three-dimensional (3D) inputs—height, width, and spectral depth of each sample. This model employs convolutional layers to extract and integrate localized information via shared weights, followed by fully connected layers that generate two-dimensional (2D) compressive strength maps.
The network architecture of the SegS_DNR model is depicted in Fig. 8b. It comprises a triple-layer convolutional block, a dropout module, and a fully connected three-layer structure. After the block spectral features undergo three stages of convolution and dropout regularization, they pass into the fully connected layers to yield the compressive strength output. Each layer incorporates batch normalization and ReLU activation functions. Fundamental hyperparameters like the learning rate, total epochs, and kernel size were fine-tuned via 5-fold cross-validation performed on the training portion of the dataset for hyperparameter optimization, leading to optimal values of 0.01 and 150 for the learning rate and epoch count, respectively. The size of the input blocks significantly influences the SegS_DNR model’s ability to represent spatial-spectral features. Considering the spatial resolution of the images and the dataset’s total volume, we determined the optimal input dimensions by evaluating various block sizes and selecting the configuration that yielded the best predictive performance. The model parameters are detailed in Table 2. To generate the 2D compressive strength heatmaps (see Fig. 10e), the hyperspectral image cube is processed using a sliding block approach. Input blocks of optimal size (5 × 5 spatial pixels × 1024 spectral bands) were extracted with a stride of 1 pixel in both row and column directions. The SegS_DNR model predicted a single compressive strength value for each input block, and this value was assigned to the central pixel of that block in the output heatmap. This dense, pixel-wise prediction map was then visualized using a continuous color scale.
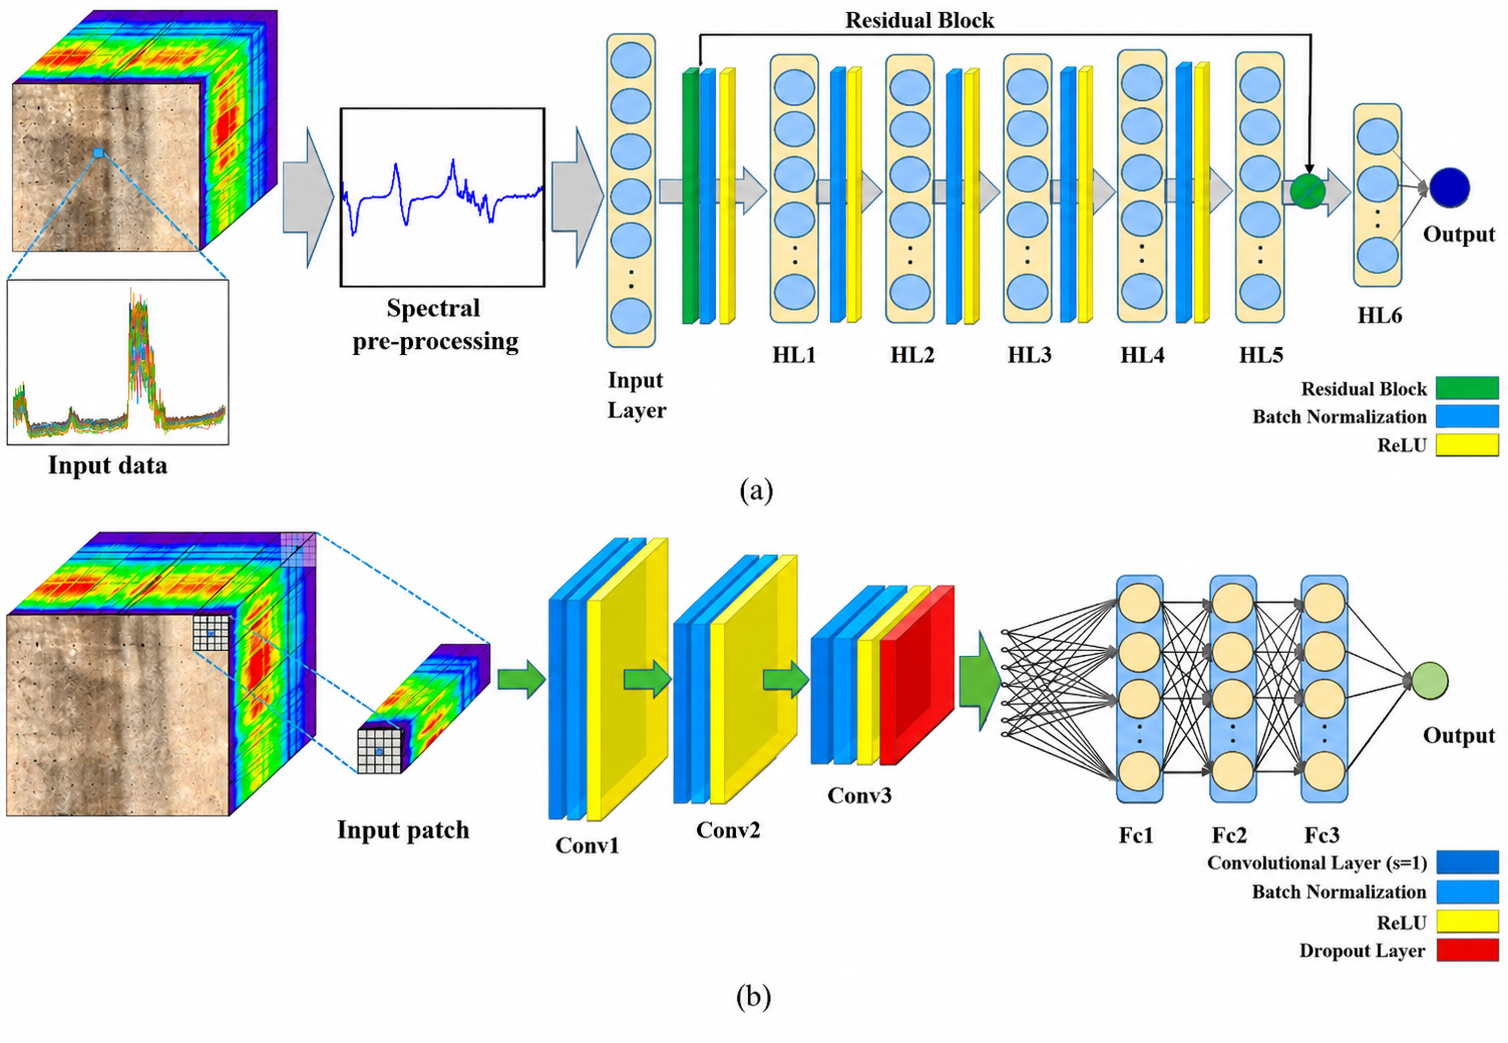
Fig. 8. Architectural framework of the proposed regressors: (a) The mono-spectrum deep neural regressor (MS_DNR), and (b) segmented-spectrum deep neural regressor (SegS_DNR).
Table 2
The parameters of the designed segmented-spectrum deep neural regressor model.
Layer Name | Function | Filter Size | Output tensor |
|---|---|---|---|
Input layer | 5 × 5 × 1024 | ||
Convolutional layer 1 | Stride = 1/Batch normalization/ReLU | 3 × 3 | 5 × 5 × 512 |
Convolutional layer 2 | Stride = 1/Batch normalization/ReLU | 2 × 2 | 5 × 5 × 256 |
Convolutional layer 3 | Stride = 1/Batch normalization/ReLU | 2 × 2 | 5 × 5 × 128 |
Dropout layer | Dropout rate = 0.5 | 5 × 5 × 64 | |
Fully connected layer 1 | Batch normalization/ReLU | 1 × 32 | |
Fully connected layer 2 | Batch normalization/ReLU | 1 × 16 | |
Fully connected layer 3 | Batch normalization/ReLU | 1 × 1 |
4.2. Model evaluation metrics
In this study, the MS_DNR and SegS_DNR DL frameworks were implemented in PyTorch, while the RFR method was developed in Python. All computations were performed on a personal computer equipped with an Intel (R) Core (TM) i7-12700F CPU and 32 GB of RAM. The primary metrics used to evaluate the regression performance of the models were the coefficient of determination (R2), root mean square error (RMSE), mean absolute error (MAE), mean normalized bias (MNB), and residual prediction deviation (RPD) (Botchkarev, 2019). Specifically, R2c , MSEc, MAEc, and MNBc were used to assess calibration, whereas R2p, MSEp, MAEp, and MNBp were employed to evaluate prediction. The RPD is calculated as the ratio of the standard deviation to the standard error of prediction dataset, with the formula expressed as follows:
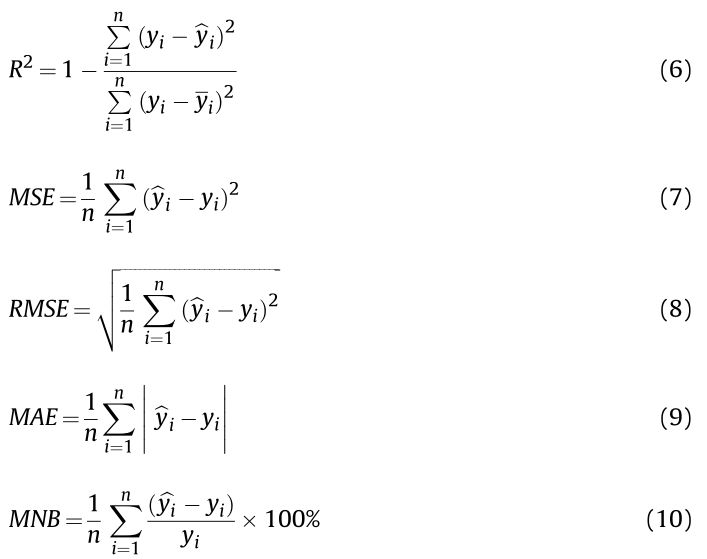

where yi is the actual compressive strength value, and ̂yi is the predicted value.
4.3. Model performance comparison
The dataset for the compressive strength estimation models (PLSR, RFR, MS_DNR, and SegS_DNR) includes hyperspectral images from 108 measurement points (1280 × 1280 × 1024) and corresponding compressive strength data obtained via a rebound hammer. This dataset was randomly split into a training set and a testing set with a 70:30 ratio. PLSR, RFR, MS_DNR, and SegS_DNR models were applied to predict the compressive strength of tunnel concrete linings. The SegS_DNR model’s predictions were affected by the size of the input spectral blocks, tested at dimensions of 2 × 2, 3 × 3, 5 × 5, and 7 × 7 to select the optimal size. The regression performance indicators for all models are detailed in Table 3, and the predictive results are visualized in the scatter plot shown in Fig. 9.
Among the evaluated models, the PLSR model demonstrates the lowest performance on the training and testing sets, with R2p < 0.6. In contrast, the RFR model shows commendable performance on the training set (R2c > 0.8) but underperforms on the testing set with R2p = 0.67, indicating limited regression accuracy. Both MS_DNR and SegS_DNR DL models markedly surpass the PLSR and RFR models in regression outcomes across training and testing datasets, significantly enhancing regression accuracy. Notably, while the MS_DNR model achieves R2 = 0.96 in training, its R2p value drops to 0.69 in testing, suggesting overfitting during training which drastically diminishes its generalization capability. Additionally, the SegS_DNR model’s input size visibly influences its regression outcomes. Integrating considerations of regression metrics and spectral block size effects, the SegS_DNR model with a 5 × 5 block size achieves the highest accuracy in predicting compressive strength, with R2p and RPD values exceeding 0.92 and 5.28 respectively, showcasing optimal regression performance. The superior performance of the 5 × 5 block size likely arises from an optimal balance in the trade-off between capturing sufficient spatial context and preserving local detail. Smaller blocks (e.g. 2 × 2, 3 × 3) might offer insufficient spatial extent for the CNN to learn robust, representative features or effectively mitigate pixel level noise. Conversely, larger blocks (e.g. 7 × 7) risk over-smoothing critical local variations indicative of strength changes or incorporating irrelevant information from pixels distant to the prediction focus, thereby degrading discriminative power. The 5 × 5 dimension appears to provide an appropriate receptive field in this study, aligning with the characteristic scale of strength-related spatial-spectral features in the concrete lining images.
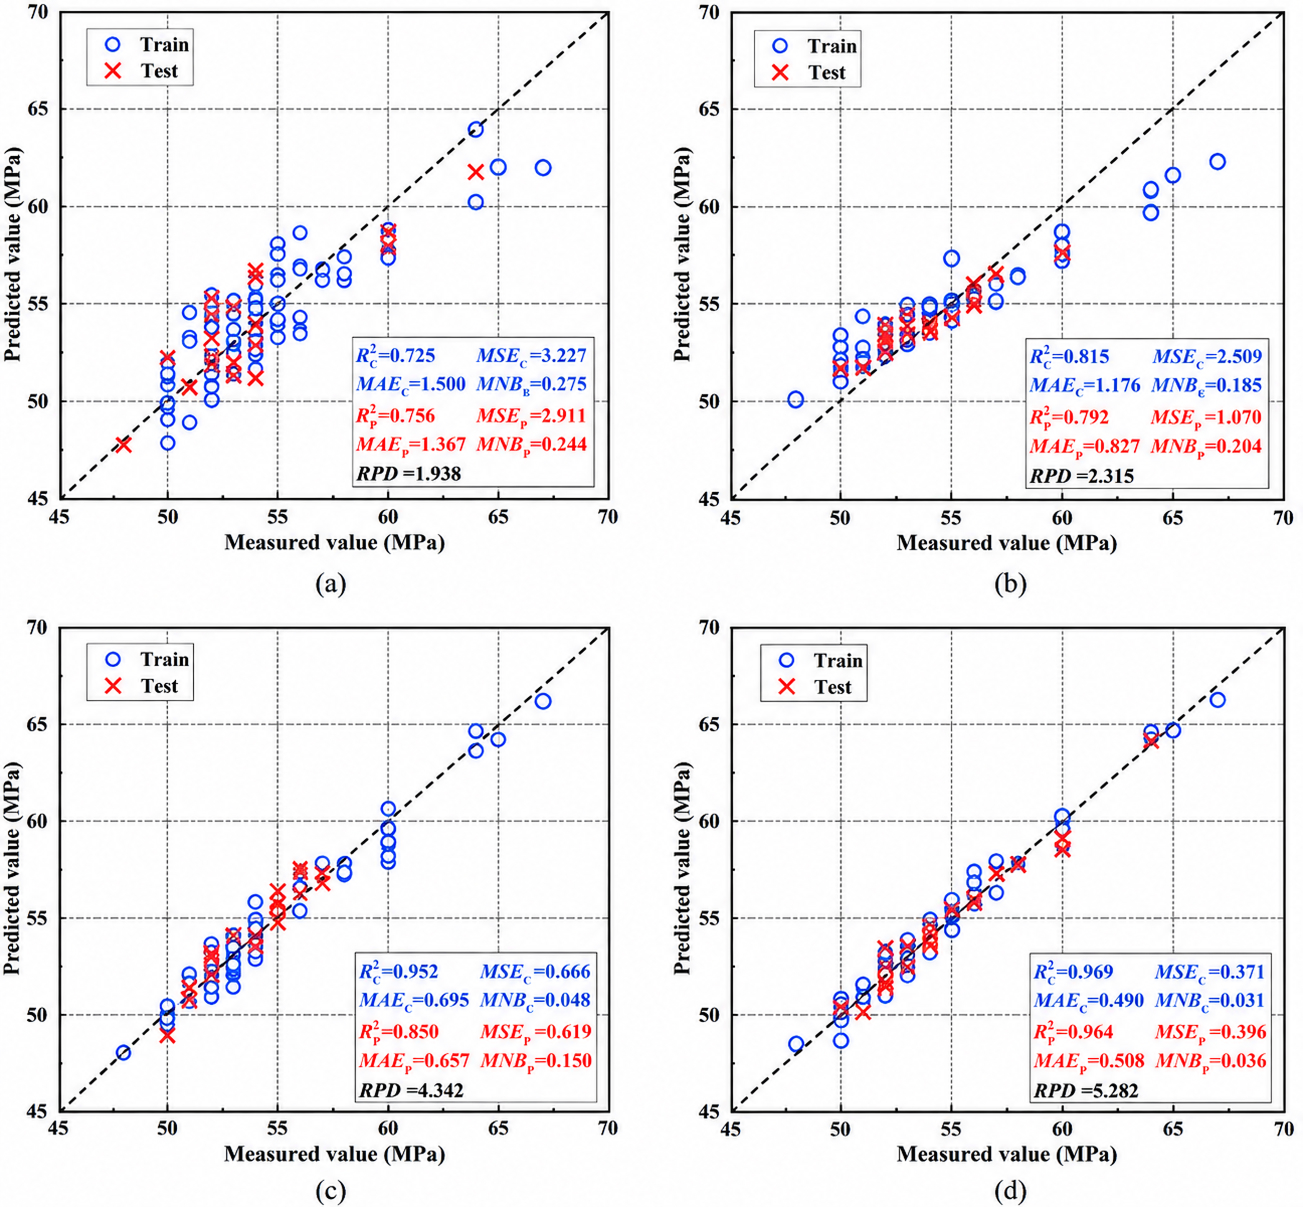
Fig. 9. Scatter plot of the measured compressive strength values and the estimated values predicted by the regression models: (a) PLSR, (b) RFR, (c) MS_DNR, and (d) SegS_DNR.
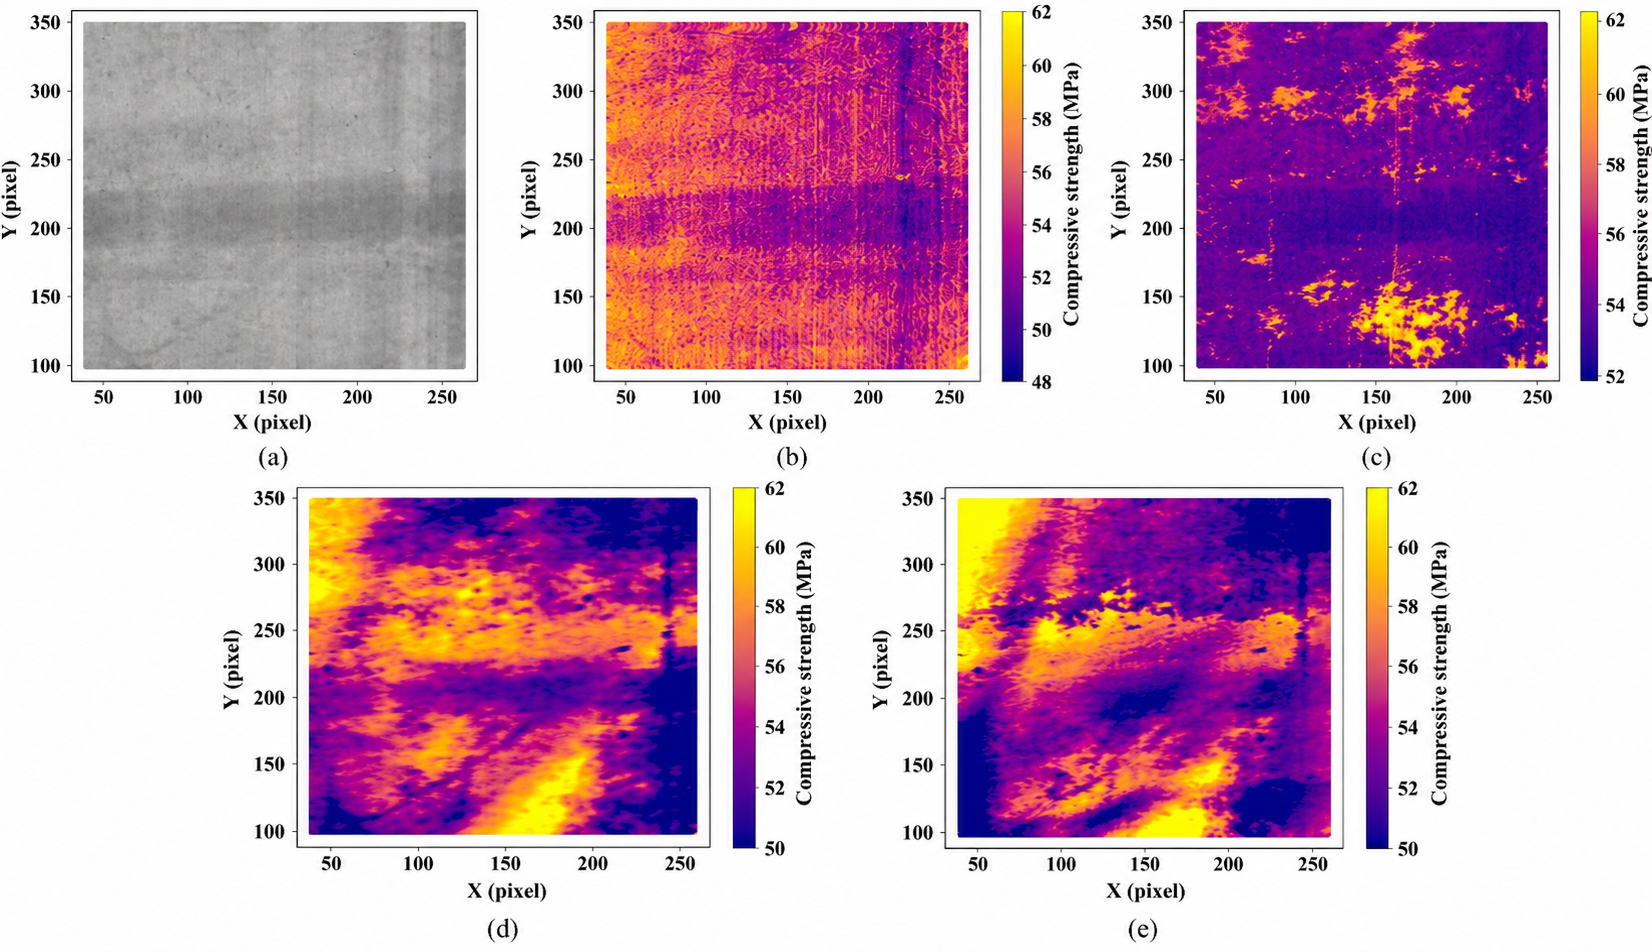
Fig. 10. Prediction distribution of concrete compressive strength in the tested area: (a) HSI image, (b) PLSR, (c) RFR, (d) MS_DNR, and (e) SegS_DNR.
Table 3
Regression results of different compressive strength estimation models.
Regression Model | R²c | MSEc | MAEc | MNBc | R²p | MSEp | MAEp | MNBp | RPD |
|---|---|---|---|---|---|---|---|---|---|
PLSR | 0.588 | 5.133 | 1.799 | 0.412 | 0.544 | 4.27 | 1.752 | 0.456 | 1.548 |
RFR | 0.832 | 2.256 | 1.112 | 0.168 | 0.672 | 1.721 | 1.048 | 0.328 | 2.61 |
MS-DNR | 0.961 | 0.55 | 0.572 | 0.039 | 0.692 | 0.945 | 0.781 | 0.308 | 4.342 |
SegS-DNR (2 × 2) | 0.883 | 1.231 | 0.838 | 0.117 | 0.881 | 2.041 | 1.228 | 0.119 | 2.917 |
SegS-DNR (3 × 3) | 0.917 | 0.924 | 0.76 | 0.093 | 0.947 | 0.783 | 0.638 | 0.053 | 3.643 |
SegS-DNR (5 × 5) | 0.968 | 0.434 | 0.503 | 0.032 | 0.925 | 0.394 | 0.532 | 0.075 | 5.282 |
SegS-DNR (7 × 7) | 0.778 | 2.268 | 1.172 | 0.222 | 0.713 | 4.86 | 1.691 | 0.287 | 2.061 |
Figs. 10 and 11 illustrate the 2D visualization of compressive strength and their corresponding predicted strength probability density functions (PDFs) for the PLSR, RFR, MS_DNR, and SegS_DNR (5 × 5). The PLSR and RFR models capture only parts of the spatial distribution of the concrete lining’s strength, lacking in detailed 2D depiction, with their predictions significantly differing from the probability density distribution of tested compressive strength (Fig. 10a and b; Fig. 11a and b). The MS_DNR model’s images exhibit the most detailed 2D strength distribution but include considerable noise, due to its reliance on mono-spectrum input. In contrast, the SegS_DNR model not only accurately reflects a vast majority of the original compressive strength distribution but also its predicted strength PDF closely aligns with the actual measurements (Fig. 11d), showing good performance.
Overall, a comparison of the regression predictions from the four models indicates that the DNN regression models (MS_DNR and SegS_DNR) effectively recognize the high-dimensional spectral features associated with the compressive strength of concrete linings. These models exhibit considerable advantages over traditional ML-based models such as PLSR and RFR, both in terms of prediction performance on the dataset and the statistical characteristics of their results. Moreover, the SegS_DNR model surpasses the MS_DNR in generalization performance and the quality of 2D distribution of prediction results. This improved generalization of SegS_DNR stems from its use of CNNs on spectral spatial input blocks. Unlike MS_DNR which processes isolated pixel spectra, SegS_DNR’s convolutional layers capture crucial local spatial context from neighboring pixels, allowing it to learn features based on spatial patterns indicative of concrete conditions. This makes predictions less sensitive to individual pixel noise. Furthermore, the hierarchical feature learning and weight-sharing inherent in CNNs enable the extraction of more robust and abstract representations from the HSI data, effectively reducing the overfitting observed in the MS_DNR model. Consequently, the SegS_DNR model is exceptionally robust and accurate in addressing complex regression challenges characterized by high dimensionality and nonlinearity.
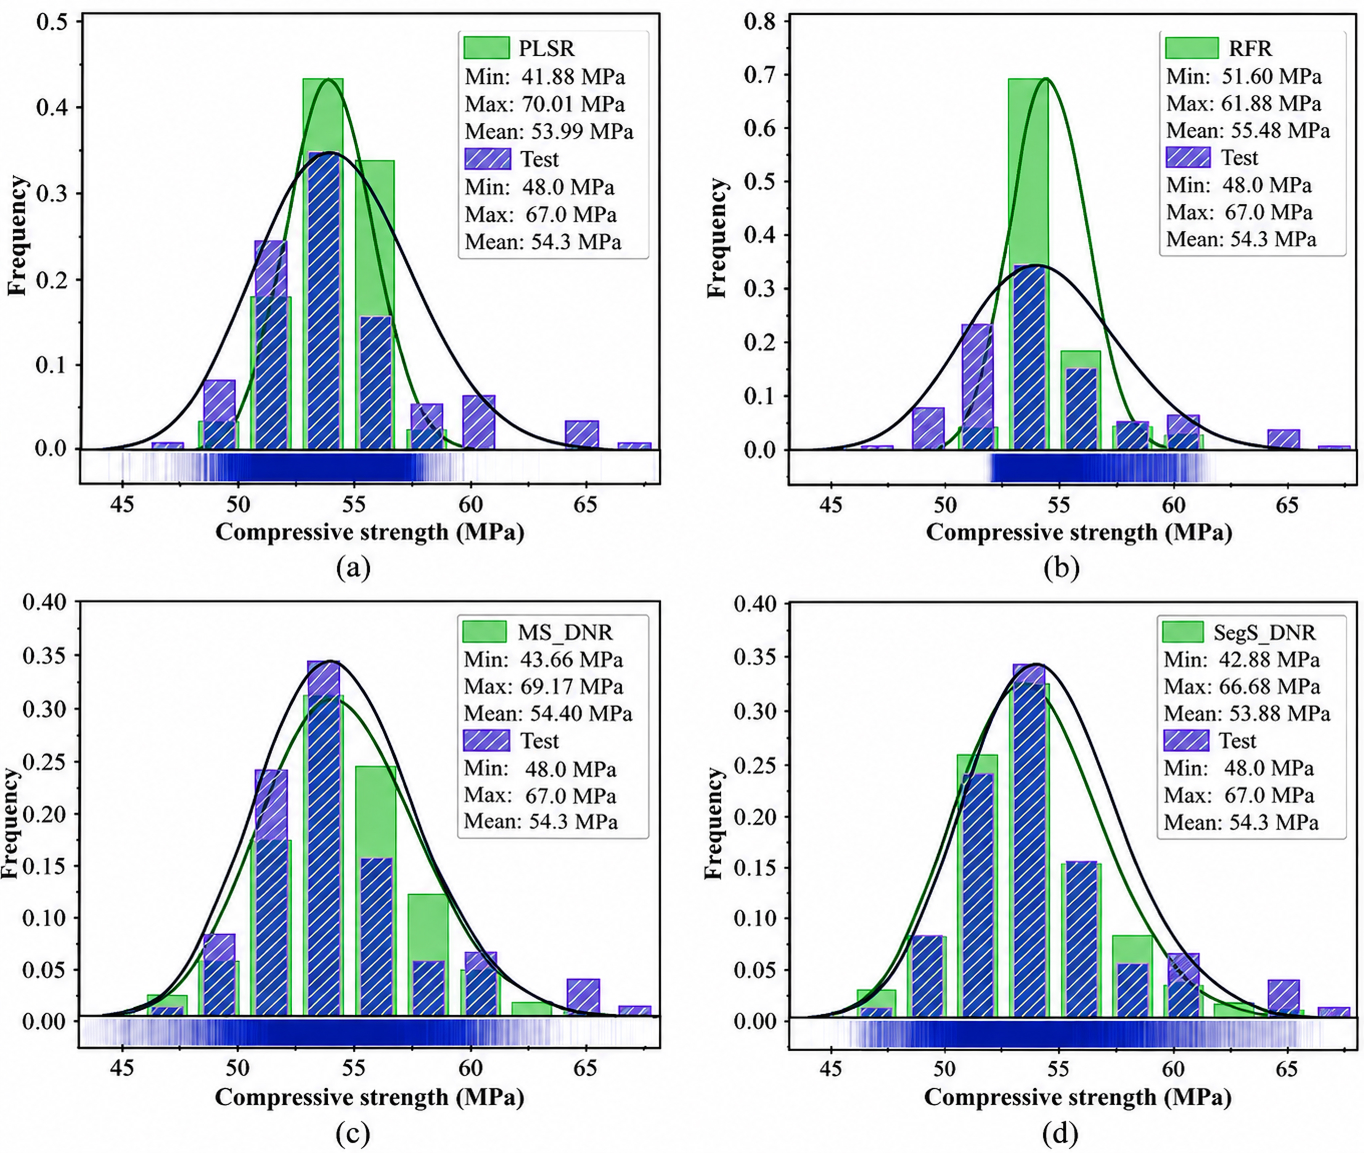
Fig. 11. PDFs of compressive strength predicted by different regression models: (a) PLSR, (b) RFR, (c) MS_DNR, and (d) SegS_DNR.
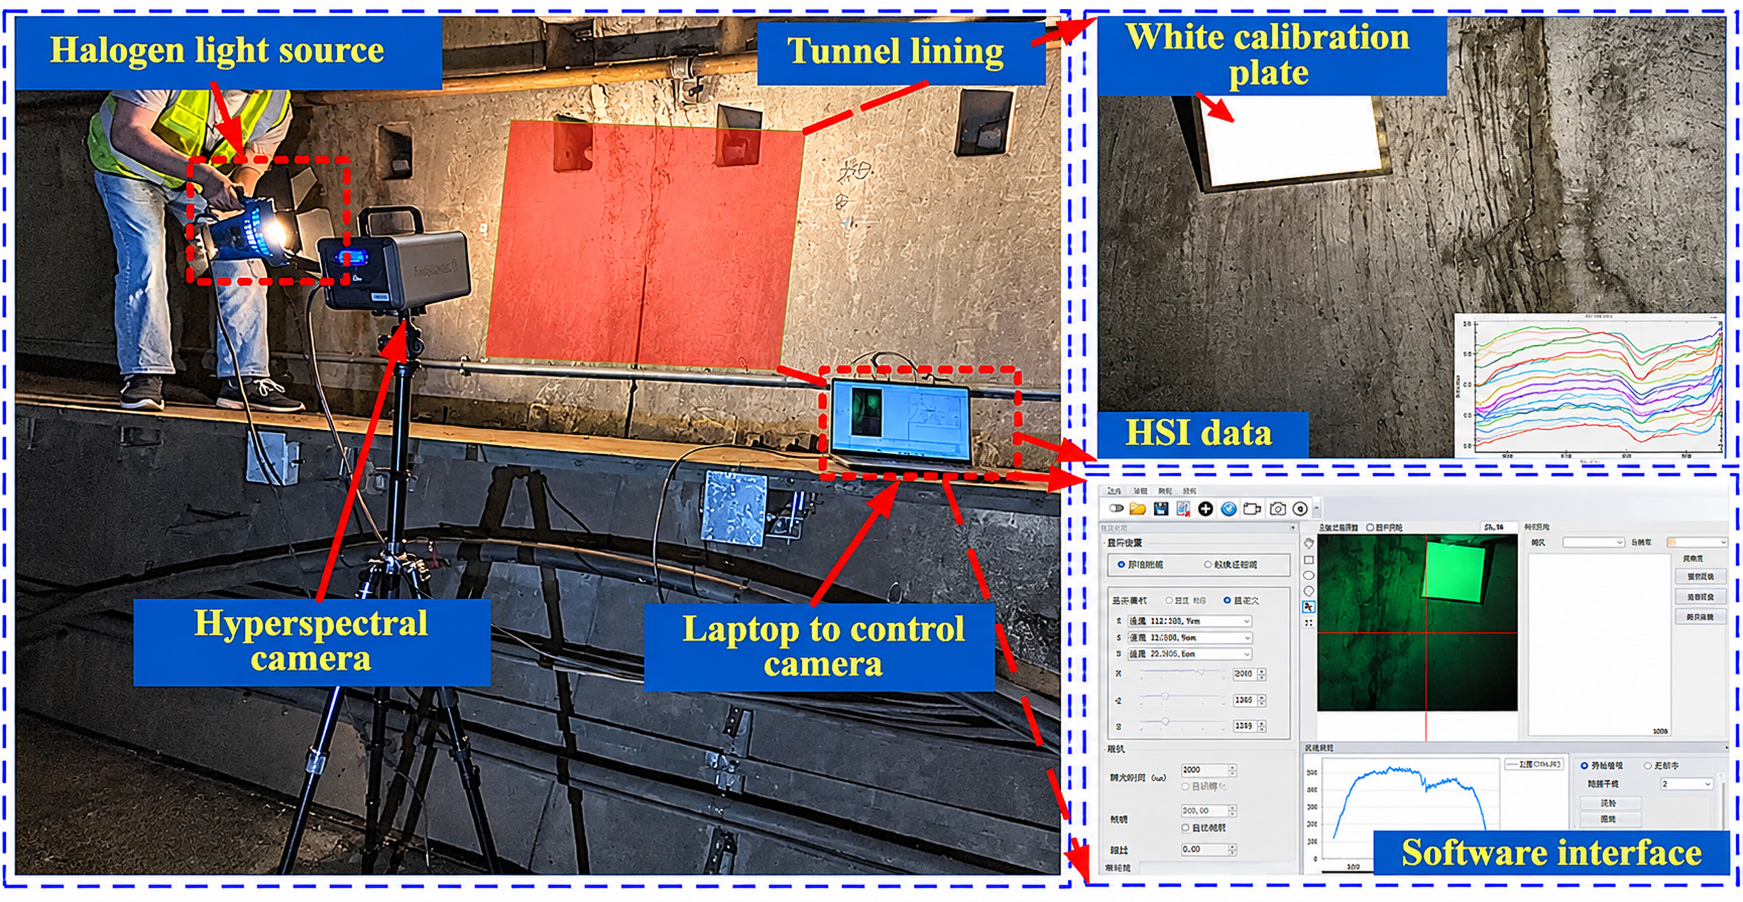
Fig. 12. Typical regional hyperspectral image acquisition environment for underground concrete tunnel lining structures.
5. Site validation and discussion
To validate the practical applicability of the SegS_DNR model proposed in this study for assessing the strength of tunnel linings, onsite HSI was carried out on the Shanghai Metro Line 12 from Shanghai Railway Station to Tiantong Road (see Fig. 2), followed by an analysis of compressive strength.
5.1. On-site test
Fig. 12 illustrates the HSI setup for concrete linings in the dark tunnel environment. This 40.4 km long tunnel opened in 2013. Its construction faced challenges due to dense urban infrastructure and the complex geological conditions along its route, particularly where it crosses beneath the Huangpu River. The sub-river section predominantly traverses soft, Quaternary alluvial and shallow marine deposits, primarily composed of layers of mucky clay, silty clay, silt, and fine sand, characterized by high water content, low strength, and high compressibility. These conditions, coupled with significant groundwater hydrostatic pressure, contributed to high operational risks and long-term lining serviceability concerns. The tunnel has an outer diameter of 6200 mm and an inner diameter of 5500 mm, with prefabricated reinforced concrete segments designed for a minimum strength grade of C55. A hyperspectral camera (900–1700 nm range) connected to acquisition software was used to capture images of typical lining areas (normal, cracked, spalling, and leaking zones). Rebound values and carbonation depth measurements were also collected in selected areas to validate the compressive strength predictions.
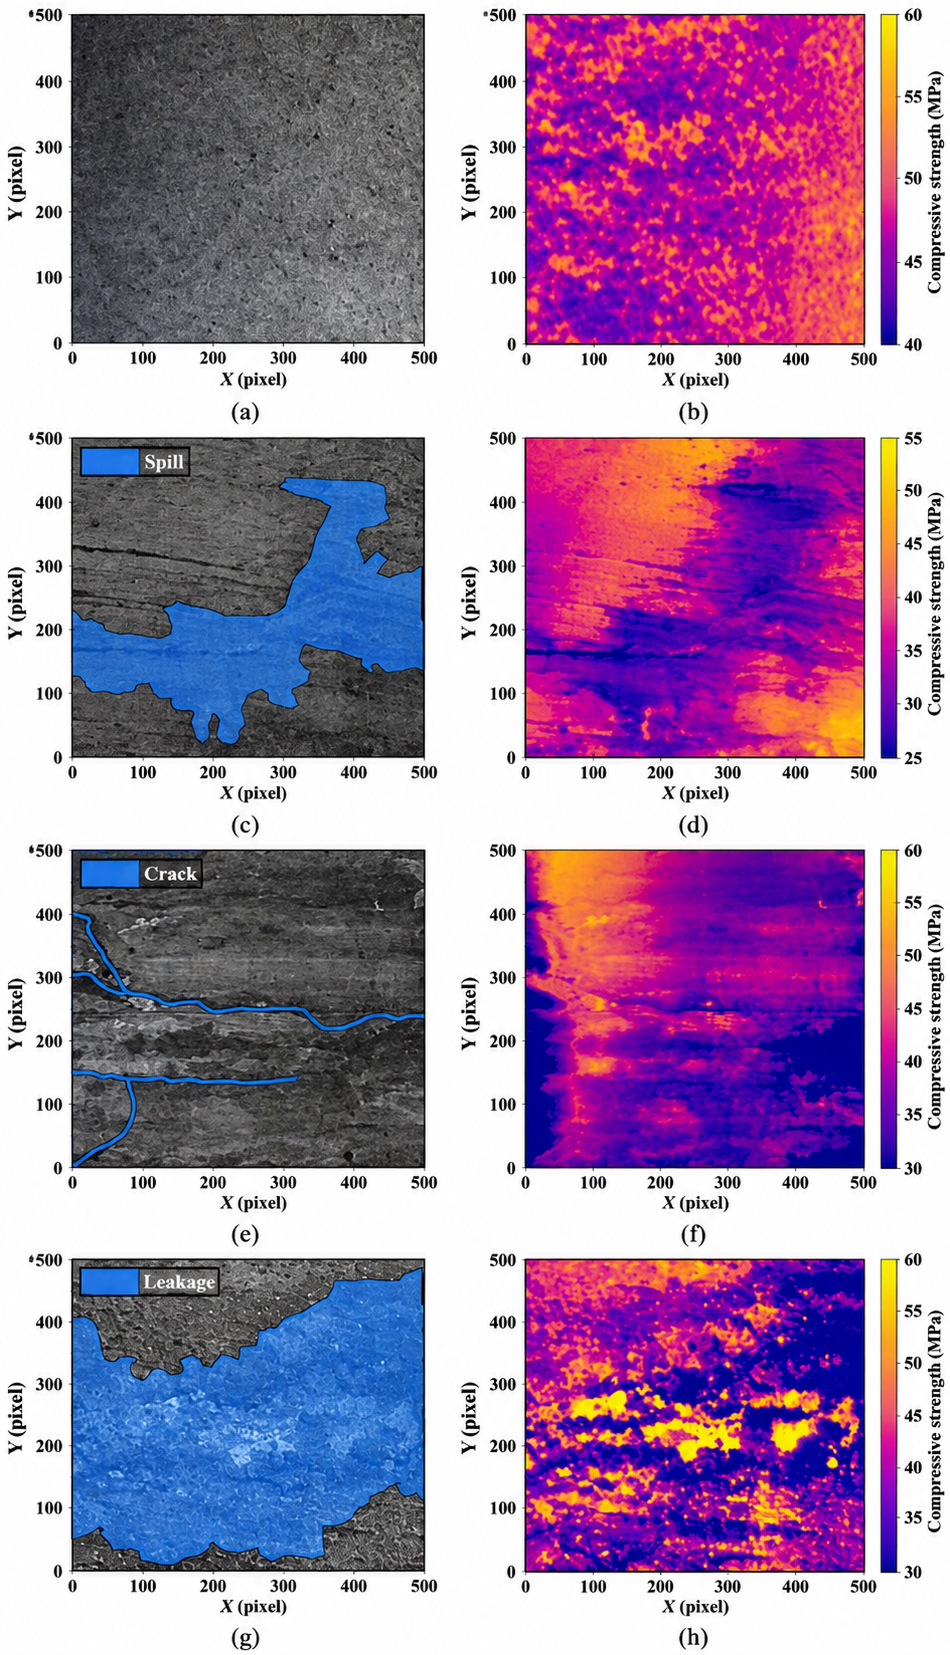
Fig. 13. Hyperspectral images and corresponding compressive strength distribution maps predicted by SegS_DNR model of typical areas: (a), (b) normal; (c), (d) spalling; (e), (f) cracked; and (g), (h) water leakage.
5.2. Validation
To validate the SegS_DNR model’s capability in assessing strength variations associated with sub-river service-induced conditions, hyperspectral images from four typical areas of tunnel linings (normal, cracked, spalling, and water leakage) were selected for a 2D visualization assessment of compressive strength using the SegS_DNR model. Fig. 13 illustrates the 2D spatial distribution of compressive strength across these typical lining areas. Integrating these images with compressive strength heatmaps demonstrates that the strength distributions derived from hyper-spectral data accurately represent the surface conditions of the linings. As shown in Fig. 13a and b, in normal areas, compressive strength hovers around 50 MPa, slightly below the designed strength of 55 MPa, a reduction attributed to the expected wear over time, displaying a random pattern in its spatial distribution.
The strength notably decreases around areas with cracks and spalling (Fig. 13c, d, e, and f), which is localized mainly around these defects and is consistent with the mechanics of crack and spall formation in linings. Fig. 13g and h depicts the strength distribution in areas with water leakage, showing a marked reduction in strength due to the erosive effects of water, which hastens the degradation of the lining’s structural strength. Subsequently, we analyze the compressive strength PDFs for different areas (Fig. 14) and their corresponding statistical distribution parameters (Table 4).
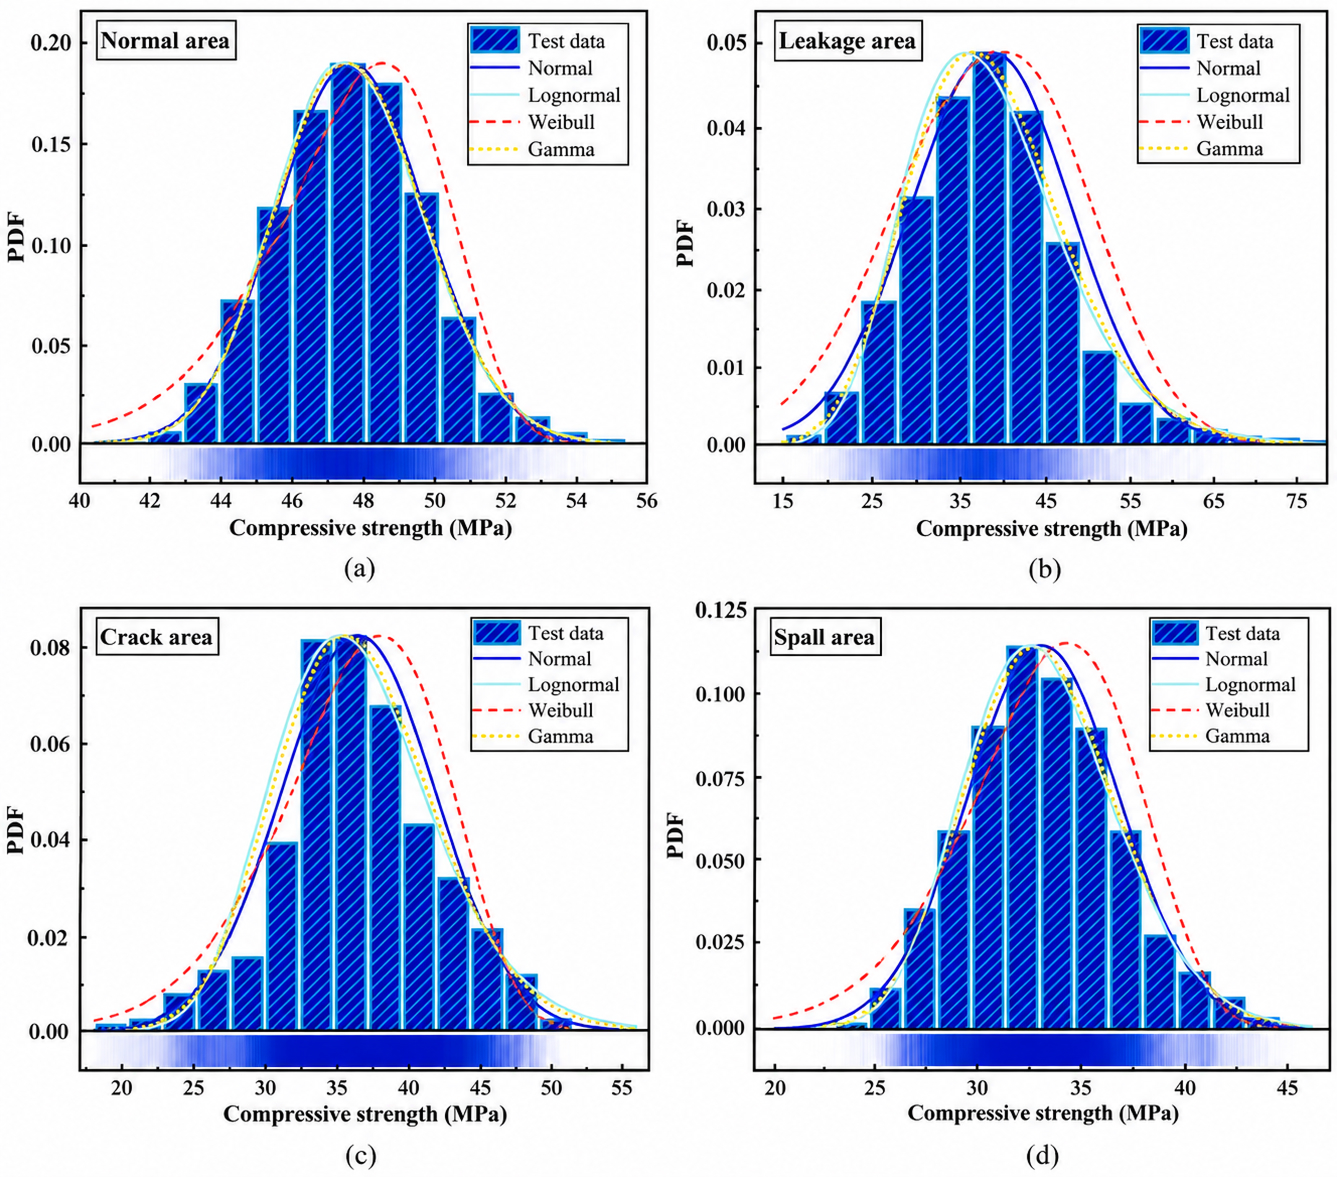
Fig. 14. The compressive strength PDFs for different areas: (a) Normal, (b) spall, (c) crack, and (d) leakage.
The distributions utilized were the normal, log-normal, Weibull, and gamma probability density functions. For the normal lining areas, the Mean (approximately 47.6 MPa) and SD (approximately 2.0 MPa) were consistent across the normal, log- normal, and gamma distributions, with similar log-likelihood values (− 67). In areas with spalling, cracks, and water leakage, the characteristics of the compressive strength distributions generally showed a decline, with mean values of 33.15 MPa, 36.32 MPa, and 37.66 MPa, respectively, which indicates a reduction compared to the normal areas. Generally, the areas with structural defects (spalling, cracks, water leakage) displayed larger SD and absolute values of log likelihood in their strength distribution functions, indicating less distinct distribution characteristics compared to standard functions. This phenomenon is attributed to localized strength reductions in linings with defects, causing an overall skewed strength distribution. Furthermore, as indicated in Table 4, both normal and log-normal distributions are considered appropriate for modeling the compressive strength of concrete structures.
From a practical engineering perspective, the statistical parameters from these PDFs (Table 4) are highly valuable. The mean and SD for distinct zones allow for the determination of more realistic characteristic strength values for structural reassessment, moving beyond nominal design figures. This facilitates targeted safety evaluations and informed repair decisions. Furthermore, these strength distributions enable probabilistic risk assessment, helping to quantify the likelihood of local strength falling below critical thresholds and thus aiding in maintenance prioritization. Zones with significantly lower mean strength or larger SD naturally warrant more immediate attention. Such data-driven strength distributions can also serve as refined inputs for advanced numerical models of the structure. Contextualizing these field validation results is challenging due to the novelty of generating 2D in situ compressive strength maps of tunnel linings via HSI and DL. While HSI has been used for various concrete assessments, direct benchmarks for in situ 2D strength mapping are scarce. Our prior work (Huang et al., 2024a). For example, we can achieve high point-prediction accuracy (R2 > 0.93) for concrete strength using HSI under laboratory conditions on specimens/models, but cannot address in situ field deployment or 2D visu-alization. The current study’s SegS_DNR model, with R2p = 0.925 and RPD = 5.282 on field data, alongside its 2D mapping capability (Fig. 13), thus represents a significant step in translating HSI from lab to practical in situ tunnel assessment. The robust field performance and clear defect differentiation (Fig. 13 and Table 4) highlight the proposed method’s potential.
5.3. Limitations and prospects
This research primarily aims at the nondestructive visual identification of the surface compressive strength of underground concrete structures. However, several limitations and avenues should be considered for future researches:
- The accuracy of HSI-based models can be influenced by environmental conditions. While our protocol included a dedicated light source and calibration, variations in ambient lighting, temperature, and the nature and extent of surface contaminants like airborne dust within complex underground environments can still affect reflectance data. For instance, varying levels of dust coverage can obscure the true concrete surface, yielding mixed spectra or spectra dominated by the dust itself, thereby compromising strength prediction accuracy. The thickness and composition of such dust layers would determine the severity of this interference. Similarly, the duration of water seepage is a critical factor; prolonged seepage can lead to more extensive leaching of cementitious components and potentially different secondary mineral formations compared to recent or transient wetting, thus altering spectral-strength relationships over time. Notably, as observed (Fig. 13h), areas with flowing water can yield unrealistically high compressive strength predictions due to water enhancing near-infrared reflectance, highlighting the need for improved compensation for such effects.
- While this study effectively linked holistic spectral patterns to strength, deeper chemo-mineralogical interpretation of the HSI data remains a challenge. Pinpointing specific mineral phases or precisely tracking their evolution over time from in situ NIR spectra of heterogeneous concrete is complex due to broad, overlapping absorption features.
- The generalizability of the current models to a wider range of concrete material properties and exposure conditions needs further investigation. The models were developed using data from specific in service tunnels. Their performance on concretes with significantly different mix designs, aggregate types, or curing histories, or those subjected to more extreme environmental factors (e.g. severe chemical attack, extensive freeze-thaw cycles) not encountered in the study sites, has yet to be fully ascertained.
Moving forward, future research should focus on:
- Developing more robust reflectance correction algorithms to minimize the impact of varied environmental and lighting conditions.
- Enhancing the specificity of spectral interpretation, potentially by integrating in situ HSI with laboratory analyses (e.g. XRD, SEM) and conducting longitudinal studies to track spectral changes over time.
- Systematically investigating the HSI-DNN approach’s sensitivity and adaptability to diverse concrete compositions, curing histories, and more extreme degradation mechanisms, which may lead to universally robust models or tailored calibrations.
- This methodological framework can be further integrated with various digitalization and automation technologies, including robotic inspection systems, IoT-based sensor networks, and Building Information Modeling (BIM), to enable real-time, continuous monitoring. Leveraging high-performance computing for large-scale projects and continually improving DL models and training strategies, alongside decreasing HSI data acquisition costs, will make these technologies increasingly adaptable, economical, and user-friendly, ultimately advancing intelligent and sustainable underground infrastructure management.
6. Conclusions
This study presents an NDT approach that integrates HSI and DNNs, providing a feasible technical pathway for automated visualization and assessment of compressive strength in underground concrete linings. The conclusions are as follows:
- An analysis based on hyperspectral images and strength datasets collected on-site from concrete structures explored the correlation between spectral features and compressive strength. Using Pearson correlation coefficients for monospectrum bands and band ratios, it was determined that relying solely on characteristic bands for estimating compressive strength proved to be impractical.
- A DL-based regression model was proposed for estimating compressive strength, showcasing exceptional capability in addressing the prediction of compressive strength from high-dimensional and complex spectral data. This model exhibited a substantial enhancement in accuracy over traditional ML models. The SegS_DNR model achieved a high predictive accuracy with R2p = 0.925, and the statistical distribution characteristics of the predicted results closely matched those of the test data.
- Hyperspectral images from several typical concrete lining areas (normal, cracked, spalling, and leaking) were collected at a tunnel site, and were analyzed using SegS_DNR model to derive 2D distributions of compressive strength. These mappings effectively represented the actual compressive strength across most of the concrete linings, with particular emphasis on the deterioration traits in regions with structural defects.
Credit authorship contribution statement
Changsong Wang: Writing – review & editing, Visualization, Software, Data curation, Writing – original draft, Validation, Methodology, Conceptualization. Mingliang Zhou: Writing – original draft, Supervision, Funding acquisition, Writing – review & editing, Validation, Investigation, Conceptualization. Le Zhang: Writing – review & editing, Resources, Data curation, Validation, Investigation. Hongwei Huang: Writing – review & editing, Supervision, Methodology, Formal analysis, Validation, Project administration, Funding acquisition, Conceptualization.


There are no comments yet!