
Ten years ago, VisualAIM’s consultants, engineers, and inspection specialists brought together our experience to develop our next-generation cloud-based API 581 Risk-based Inspection Software.
During one of our implementation projects, we needed a faster and more accurate way to create a master equipment list from P&IDs without going through a manual process. We wanted a solution capable of creating an asset register of ALL components on the drawings. The solution we found allowed us to not only generate a direct asset register from drawings but also solved a critical problem faced by facilities – how to enable the digital twin with only legacy brownfield drawings. This resulted in a new and innovative product: The Intelligent Drawing Platform (IDP).
Mission
To enable the human factor to more safely and productively operate and maintain physical assets from within the familiar environment of Piping & Instrumentation (P&IDs) and Process Flow Diagrams (PFDs).
Vision
To be the dominant provider of disruptive technology digitally transforming the asset-intensive process industries, within eighteen to twenty-four months.
Smart Drawings
The Intelligent Drawing Platform processes your plant drawings and makes them intelligent and accessible in a matter of seconds. Immediately users can search for any tag name across the drawing set.
Dive deeper into the intelligence by surfacing, contextualizing, and visualizing data on the plant drawings.
Connect external applications and data to effect actionable insights and augment situational awareness for your plant activities.
Case Studies and Success Stories
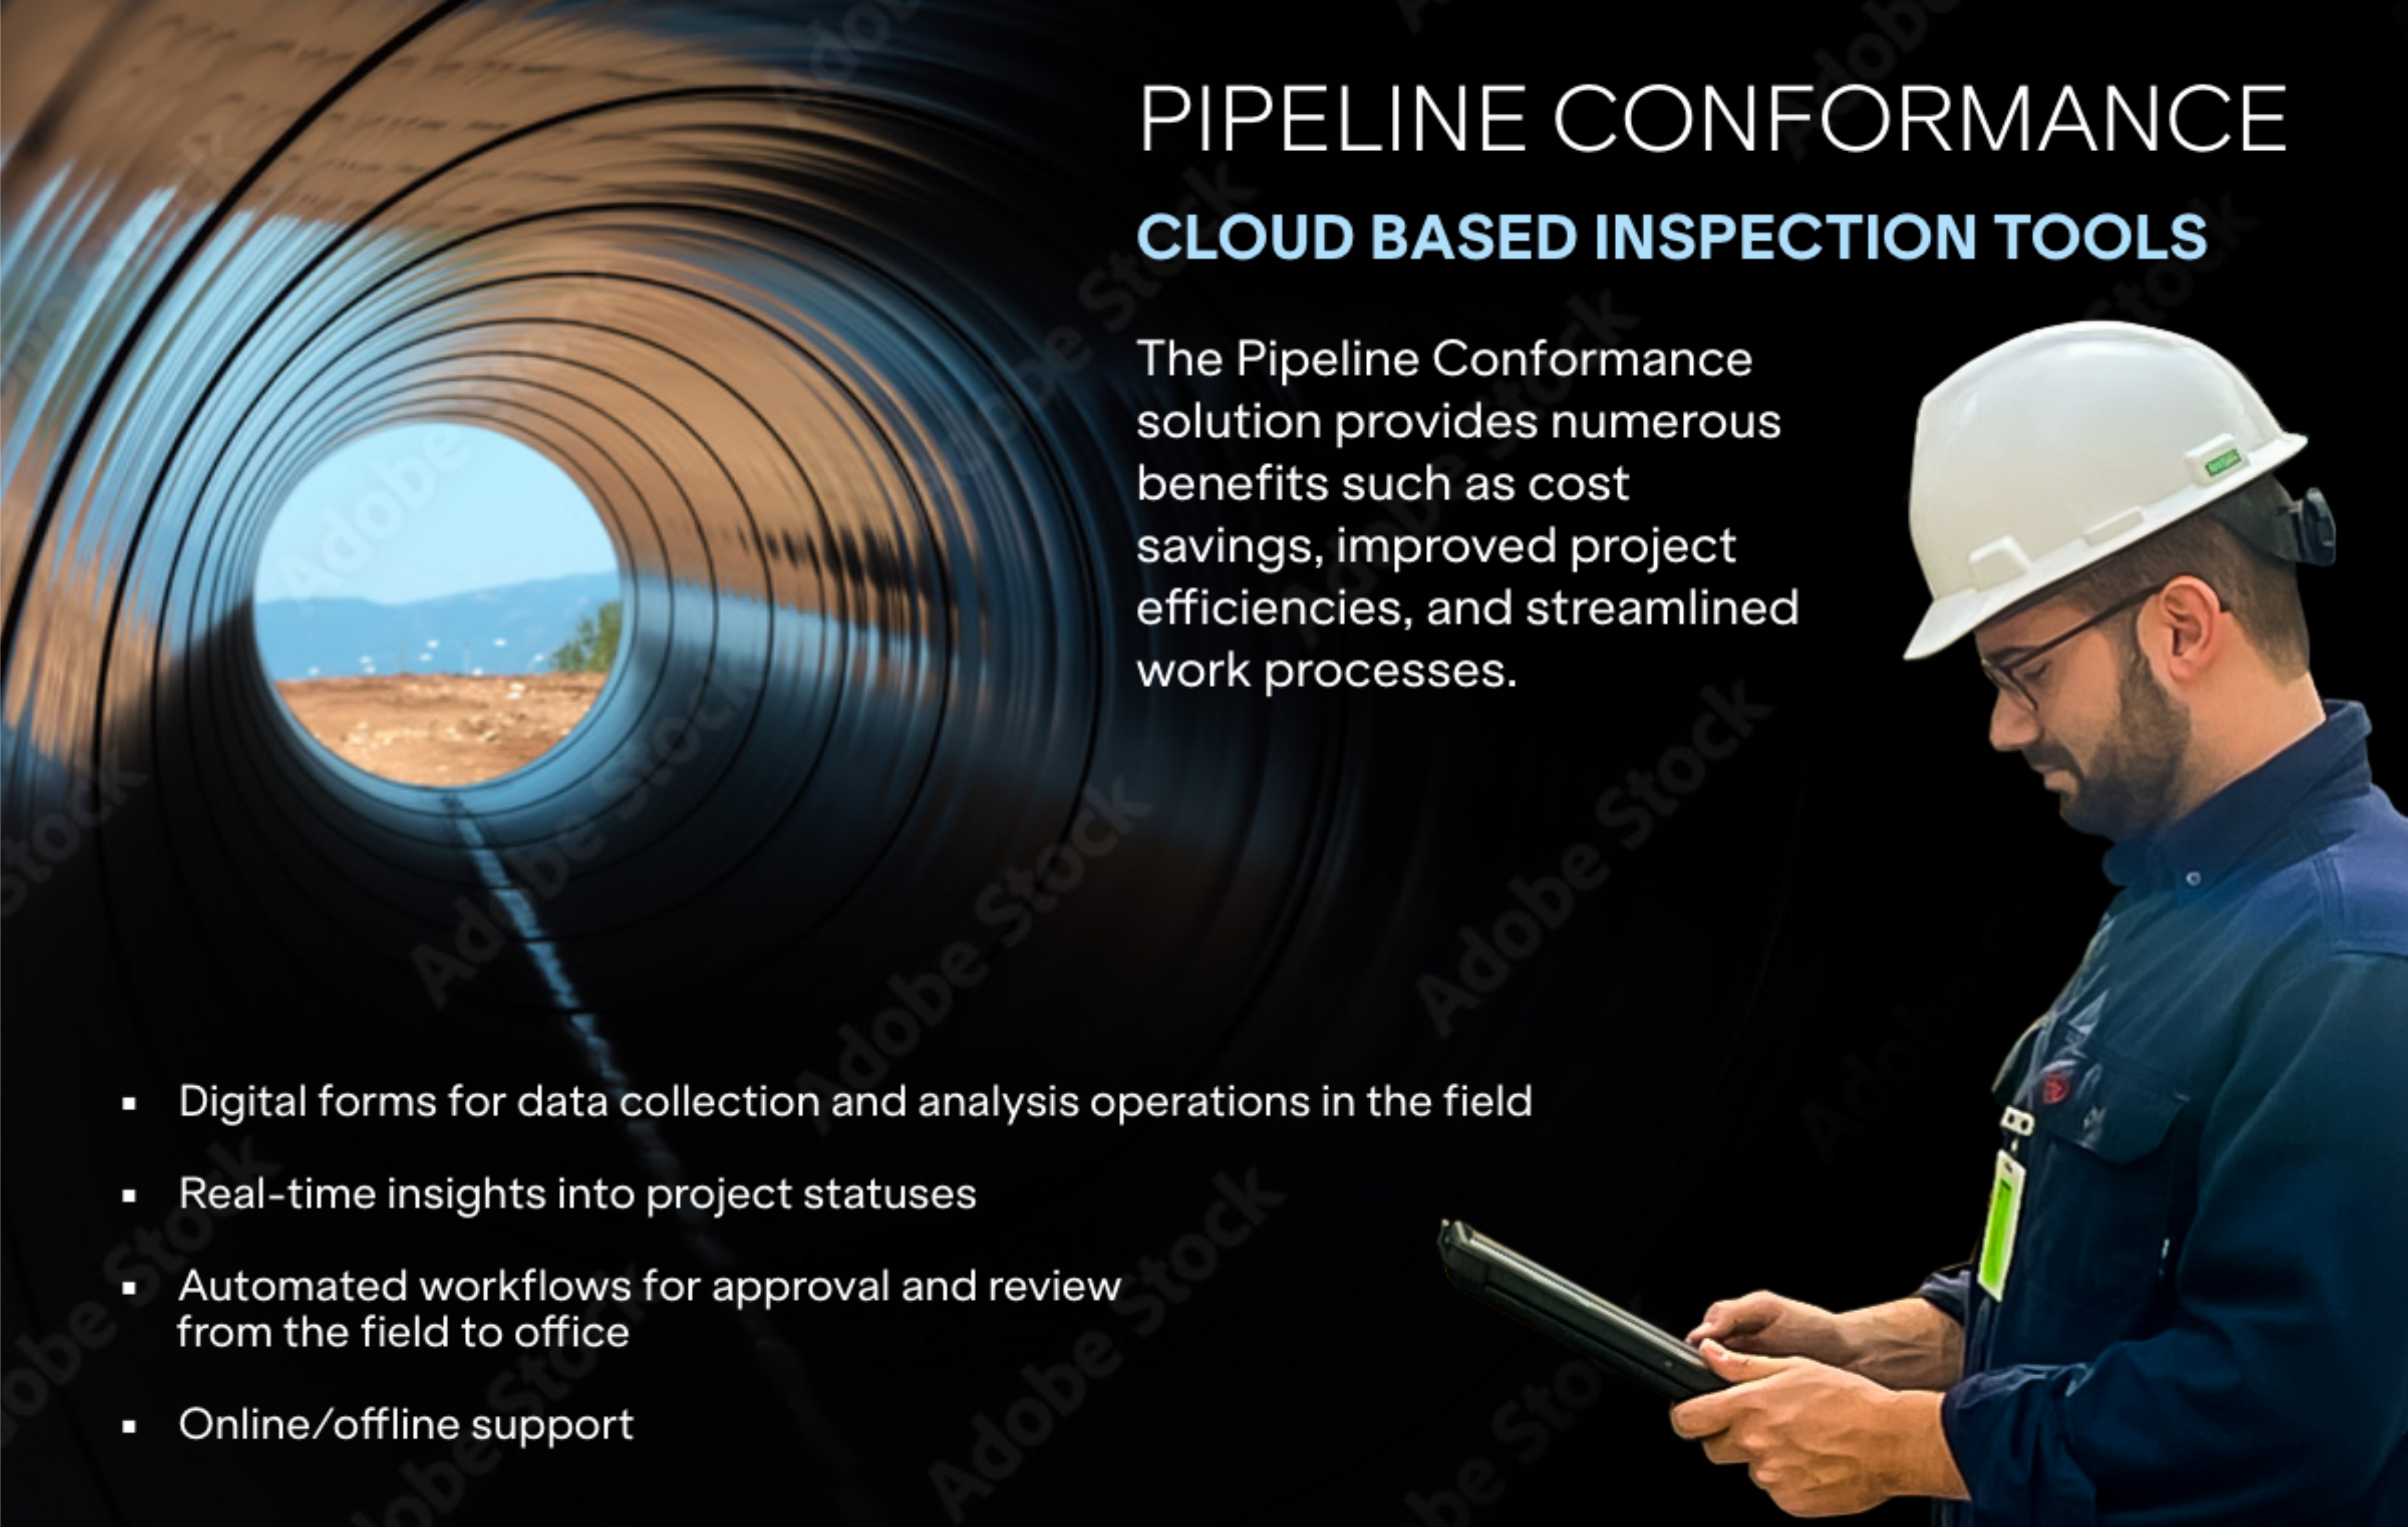
PIPELINE CONFORMANCE SOLUTION
Story 1:
For a pipeline construction project in the United States, a leading oil and gas midstream company adopted Smart Forms with workflow management to automate and streamline reporting related to the construction of a 30-mile 20” diameter pipeline.
The smart forms enabled the capture of real-time data in the field, which was automatically synchronized and validated by the head office, ensuring timely processing and reporting of critical information. Data was integrated with GIS solutions enabling project managers to surface reports onto a map for the purpose of visualization and communication. The project's construction management budget was originally 4M dollars however using smart forms, the operator managed construction with ½ the inspectors ultimately saving the owner 2M dollars. Equally important, this owner was prepared for PHMSA audits having had quality-controlled documentation that was up-to-date and accurate.
Story 2:
The oil and gas midstream operator used an Enterprise Resource Planning (ERP) system to manage their meter proving program. The system issues work orders which the field operators then perform inspections. These reports have historically been papers requiring the corporate office to correct and enter data from the forms into various systems. In an attempt to reduce costs and improve data quality (improving regulatory compliance), the owner used Smart Forms with Workflow to assign meter proving to individuals in the field who would, using their tablet, visit the equipment to perform inspections (and take pictures). The operator submits the form from the tablet, which is then audited by corporate, and when accepted, its data and calculations are immediately fed into the ERP system.
The oil-gas midstream operator believes this one automated form is saving the company in excess of 1.2MM dollars per year while improving the quality of data exponentially. Not to mention field operators are being held accountable and in effect managing their time more appropriately.
Both examples, especially when integrated with ERP or GIS solutions, enabled the company to enhance the quality of data and improve management reaction and efficient decision-making speed, ultimately reducing project costs while providing enhanced regulatory compliance and safety.
Digital transformation and innovation demand creative thinking, but the savings it brings often surpasses returns from other investments in the company.
ASSET REGISTER
Extract equipment inventories from your P&IDs to verify coverage of your mechanical integrity program. The IDP classifies all the symbols contained on the drawings to understand the location and data related to each asset (valve, vessel, instrument, relief valve, pump, etc) allowing the platform to export an inventory representative of all assets across 100 or 10,000 drawings. As one of the IDP’s first use cases, a chemical manufacturer in Texas utilized the asset register to perform a gap analysis between the equipment list extracted from their 400 P&IDs and the facility’s mechanical integrity software asset register. The discovery was that 40% of the pipe tag names present on the drawings were not managed in their mechanical integrity system. With this information, the site was able to consolidate the asset registers and re-attain compliance with regulatory requirements.
CHEMICAL MANUFACTURER
TIMELINE: 400 DRAWINGS, 1 WEEK
VALUE: COMPLIANCE, UNLOCK DATA ACCESS
REDLINE
Use the platform as your central hub for creating and tracking drawing redlines to keep your drawings up to date. The IDP has a redline feature that allows users (maintenance, inspection, and operations personnel) to reflect changes they see in the field directly on the intelligent drawings through a tablet while performing their day-to-day activities. The redlines performed on the drawings understand the specific assets and components affected. This allows users to describe changes to specific components on the drawing. The redlining tool also enables 80% of drawing changes (text changes, symbol additions, flow direction corrections, etc) to be executed directly through the tablet and re-exported into the master CAD file. The redlines are then reviewed and follow the owner-operator’s management of the change process (MOC) to update the master CAD file. The IDP reads the latest version of the file and synchronizes it into the platform, keeping drawings continuously as built.
REFINERY
TIMELINE: IMMEDIATELY UPON DRAWING PROCESSING
VALUE: AS-BUILT MAINTENANCE OF DRAWINGS
PREDICTIVE ANALYTICS
Accurately align your process data with equipment variables to accelerate your implementation of predictive analytics. Our customer was facing the challenge of aligning data tags of process variables (pressure, temperature, flow, etc) with equipment variables (e.g. discharge pressure for a pump or inlet temperature for a heat exchanger) across 5,100 P&IDs. Upon intelligizing the drawings, the IDP’s Hierarchy tool was utilized to effectively align the instrument data with the asset variables and deliver the project in 8 weeks instead of the originally expected 130 weeks through manual methods. High IP drawing selections were executed by the customer by training their technical services team on how to use the IDP in a matter of minutes.
REFINERY
TIMELINE: 8 WEEKS
VALUE: TIME TO VALUE REDUCTION BY 94%
PROCESS MAPPING
Visualize process lines across multiple P&IDs in a single view to improve operations and maintenance activities. The Process Mapping feature of the IDP allows users to define process lines from their origin to their destination. This, in turn, allows the platform to map a process line that flows across multiple drawings to be visualized in a single view. A Global Terminal Operator utilizes this feature to visualize their fluid transfer processes across multiple drawings to visually ensure operators open or close the appropriate valves in the alignment process prior to the commencement of the transfer. This greatly mitigates the probability of product contamination or spillage due to manual operation.
GLOBAL TERMINAL OPERATOR
TIMELINE: 4 WEEKS
VALUE: MITGATION OF PRODUCT CONTAMINATION AND SPILLAGE
SITUATIONAL RISK AWARENESS
Colorize your drawings so that each asset reflects its current risk level in real-time based on your RBI (Risk Based Inspection) analysis results. Through connectivity to other applications, the intelligible drawings can visualize, surface, and contextualize data for quick decision-making. In the example shown, a customer’s RBI solution was connected with the intelligent drawings, allowing maintenance personnel to view the risk level of any asset on the drawings by colorizing them in accordance to their latest analysis result. This allows the turnaround planning team to prioritize inspections and focus resources on high-risk equipment in an effective manner.
REFINERY
TIMELINE: 4 WEEKS
VALUE: COMPLIANCE, DATA MANAGEMENT, DATA VISUALIZATION
MECHANICAL INTEGRITY
Keep an online record of your piping circuit definitions and colorize their thickness monitoring locations on isometrics to reflect renaming life. VisualAIM’s Mechanical Integrity (MI) Suite is a platform for the inspection management of fixed equipment. It is equipped with an API 581-compliant risk engine, time-based inspection planning strategies, an inspection data management system, and a file repository for equipment documentation. The existent API integration between the MI Suite and the IDP allows VisualAIM customers to manage inspections more effectively by visualizing mechanical integrity data through intelligent drawings and executing inspections through field tablets that synchronize back to the platform.
NYLON MANUFACTURER
7 FACILITIES
VALUE: COMPLIANCE, DATA MANAGEMENT, DATA VISUALIZATION
Technical Specifications
Cloud Based SaaS


