Microwave Testing
Hand-Held Scanner for Nondestructive Microwave Testing
Published on 15th March 2023

1. Introduction
Microwave testing has proved to be successful to test devices made from glass-fiber or natural-fiber rein- forced plastics and further electrically isolating mate- rial. Distinct indications are generated from defects as for example air inclusions or foreign material. The momentary measurement is local; an image can be generated by scanning the device’s surface. For prop- er device sizes and shapes this can be done in the test laboratory. However, having large devices to be test- ed, as for example rotor blades of wind turbines, rail or water vehicles as well as chimneys, absorber tow- ers, and further industrial plants, on-site testing is necessary. Furthermore if the devices contain free form surfaces not all ways the application of a robot is profitable. For such applications a hand-held micro- wave scanner has been developed in cooperation be- tween the FI Test- und Messtechnik GmbH and the Magdeburg University of Applied Sciences in its research project MINTECO.
2. Description of the Hand-Held Scanner
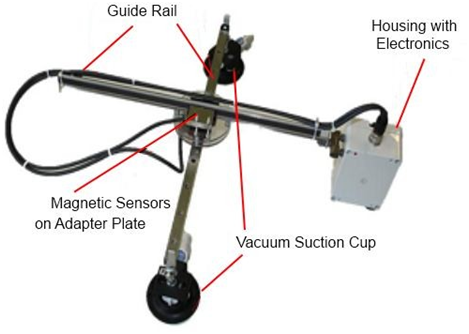
It contains two vacuum suction cups for the fixing on the device under test. The housing with electronics can freely be moved over an area of 20 cm x 30 cm while guided by the guide rails. The surface may be slightly curved; the inclination of the surface to be scanned is arbitrary. The housing with electronics, see figure 1, contains also the microwave sensor which, guided by hand, touches the device surface and scans it. Information regarding the position, together with the measurement signal are transmitted by Bluetooth to the laptop. There they are displayed as a pseudo color image, similar to a C-Scan. The image develops in single pixels corresponding to the already scanned surface sections. The testing is done at a frequency of 24 GHz using a waveguide antenna
3. Test Examples
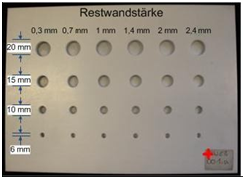
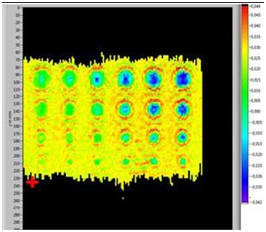
Figure 2: PTFE plate
a) Photograph. b) Display of the hand-held scan system after inspection from the plane side. This figure is reversed left to right when compared with the photograph.
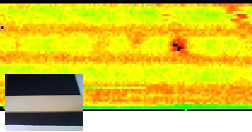
Figure 3: WPC hollow section profile with defects. Visually these are not recognizable, see inset photograph.
This method is also applicable for ceramics. Figure 4 shows a scan result for a ceramic tile with a through bore hole and three blind holes. All these four artificial defects are clearly recognizable in the C-scan.
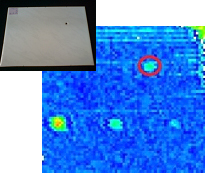
Figure 4: Ceramic tile with a through bore hole and three blind holes. The inset photograph shows the tile from the tested side.
The following examples show on-site applications of the hand-held scanner at big devices. Figure 5 shows the inspection of a rotor blade of a wind power plant.
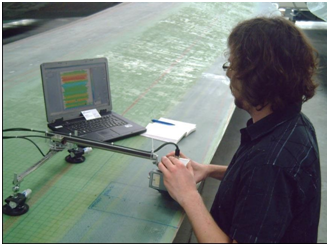
Figure 5: Inspection of a rotor blade of a wind power plant with the hand-held microwave scanner.
Figure 6 shows the application of the hand-held scanner during the inspection of a GFRP absorber tower of a refinery for testing in the regions of leakages. In the C-scan, see figure 6b, the dark blue regions indicate the product distribution below the surface.
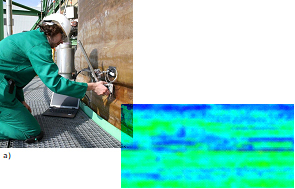
Figure 6: Inspection of a GFRP absorber tower of a refinery for product distribution in the regions of leakages. a) The hand-held-scanner in use. b) C-scan. The blue regions indicate the product distribution below the surface.
During a stoppage in production this absorber tower could also be inspected from the interior. Figure 7 shows in its left part the photograph of a visually recognizable scratch. The red part gives the C-scan in this region and shows the extent of the product below the surface.
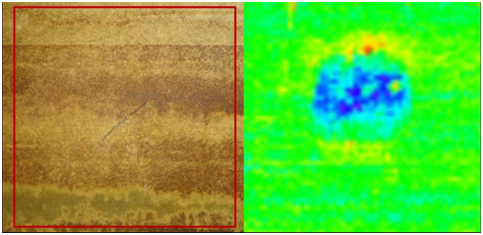
Figure 7: Interior scratch in the absorber tower. Left: Pho- tograph. Right: C-scan with indication of the product dis- tribution in the wall.
4.Conclusion
The described hand-held scanner is a versatile in- strument. This has been shown in example applica- tions in the laboratory and on-site. During manually scanning of the inspection surface the image of the C-scan develops gradually. So the inspector has an immediate impression of the inspected region. The pixel size and further parameters can be adjusted in the control and display module (laptop). Furthermore it is later on possible to evaluate the generated file by post processing.
Contact:
Prof. Dr.-Ing. Johann Hinken
FI Test- und Messtechnik GmbH Breitscheidstraße 17
D-39114 Magdeburg Germany
Tel.: +49-(0) 391-886-8129
Mobil : +49-(0) 171-2053208
Fax: +49-(0) 391-886-8130
E-Mail : info@fitm.de www.fitm.de