
Non-destructive testing (NDT) is vital in terms of safety. Its importance is often underrated. Proper testing prevents accidents, breakdowns, and potential threats to society. It assesses the safety of various components. This applies to the aerospace industry as well as construction and pipelines. Certified inspectors examine the parts without causing harm to them.
This article deals with the metric to describe the accuracy of testing: the Probability Of Detection (POD).
If you want to learn more about non-destructive testing, be sure to check out our other articles:
- The 5 Types – What Is Non-Destructive Testing (NDT)?
- The 10 Common Weld Defects You Should Know.
- Definition: What are NDT 4.0 & NDE 4.0?
What is the POD - Probability Of Detection?
The Probability Of Detection (POD) is a metric to describe the accuracy of a test. This statistical method identifies how well an inspection procedure detects vital defects.
To err is human. This applies to NDT as well. The POD assesses the minimum flaw size and syncs the quantitative and qualitative parameters. For this, you have to plot the size of flaws against the relative flaws detected. Experienced inspectors usually have better POD.
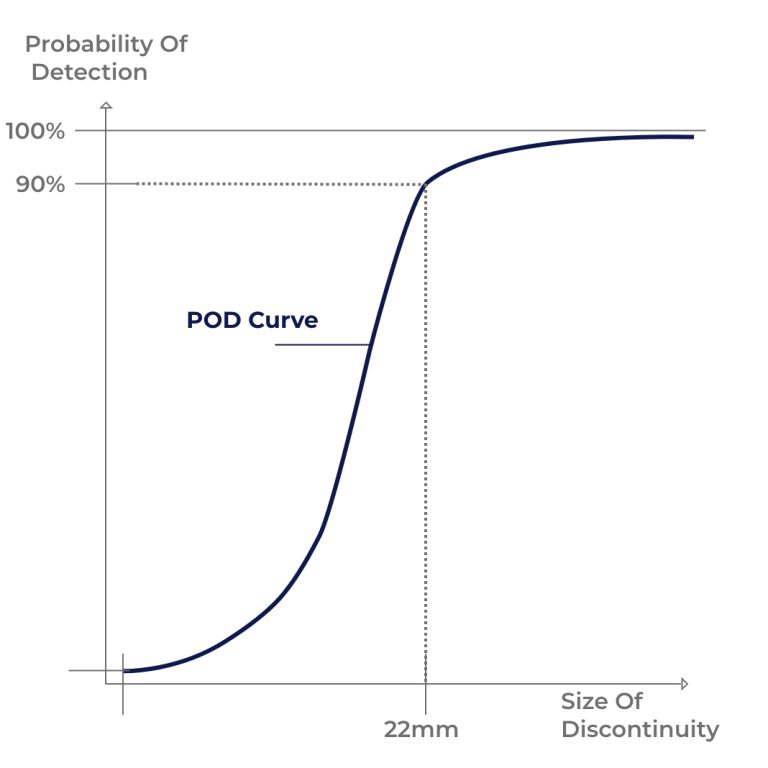
The following diagram shows a POD Curve. On the x-axis the size of the discontinuity is shown and on the y-axis the POD. The probability runs asymptotically against 100%. At the marked point the POD is 90% for a flaw size of 22mm.
Where is POD used in NDT?
In NDT, we use POD for various purposes. First and foremost, it helps establish compliance with standard requirements for inspection quality. To sum it up it is used in military, aerospace, construction and pipeline industry for:
- Establishing compliance
- Input for risk-based inspection (RBI)
- Input probabilistic safety assessment
- Damage tolerance analysis
- Scheduling of inspection intervals
- Construction & part acceptance criteria
What is the 90/95 rule for NDT?
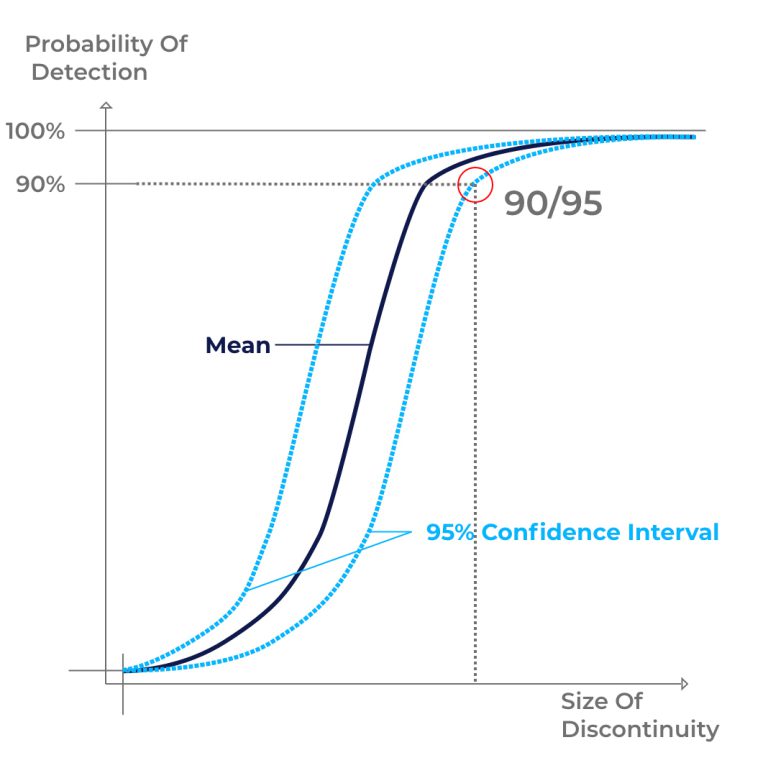
NDT officials often say, “90% POD with 95% confidence.”. The ‘90/95’ flaw size information is used as a reference. It basically gives insight on how a method/system is performing most of the time. The confidence (interval) is a statistical tool to approximate the POD for a testing method.
[E. Ginzel – Materials Research Institute. Introduction to the Statistics of NDT. ]
The following graph now is adapted to show the mean POD and the confidence interval of 95%. What it says is basically we find the flaw with a 90% chance and we are 95% sure about it.
How to determine the POD?
We can determine POD using many techniques in NDT. This applies for several tests like ultrasonic testing (UT), radiographic testing (RT), and visual testing (VT) among others. What you need is data. For real world examples you have to run several “experiments” under constant conditions to approximate the POD curve. You could take three inspectors and show each of them 500 images of different (known) defects or good parts. How many defects of a size have been detected? Plot a graph of the results e.g. using EXCEL and you have a simple approximation tool. You can vary between inspectors, parts, methods, equipments and so on. The more data the better.
Additionally you can use one of the following methods to create a statistical model for the POD curve:
- Simple distribution functions
- Parameter estimation procedure
- Range interval method
- Maximum Likelihood Estimators (MLE)
- Log-logistic function
What are benefits of using a POD?
In many cases, we use different inspection techniques. With a POD in place, we can effectively compare the alternative procedures. In short, we can determine the most accurate of them. On the other hand, these POD values also serve as a target to achieve for testing processes. If the methods are comparable, we also can detect deviations in the process. If you check two PODs of the same methods, you can e.g. detect damage or unreliable equipment.
[BINDT, The British Institute of Non-Destructive Testing. Probability Of Detection.]
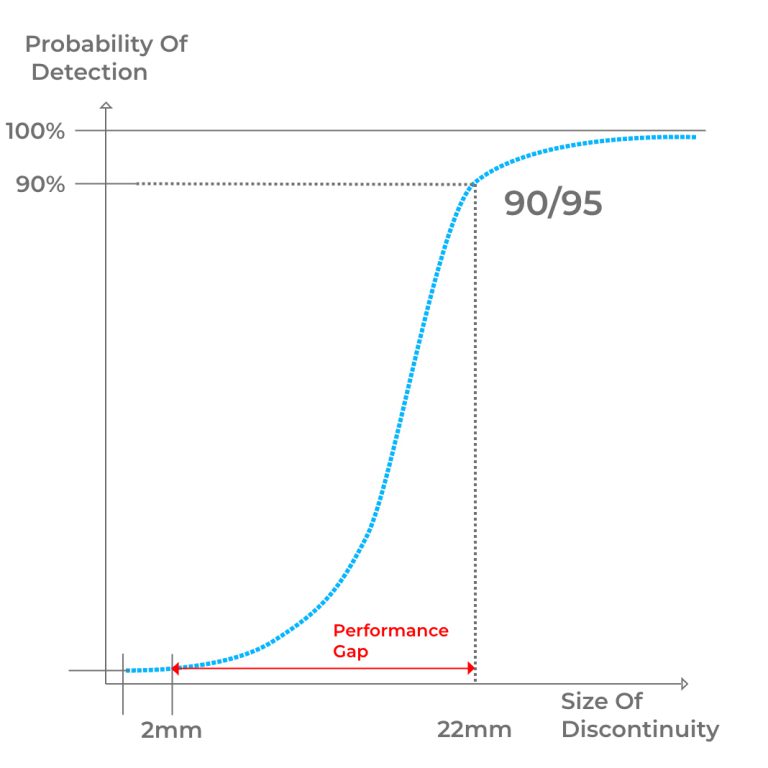
This is the best performance your system or method could achieve. The larger the gap the more you can improve.
The POD can also be a motivation to push to the limits of the inspection system. The smallest discontinuity we can find in a system is called the intrinsic capability. We want to push the ‘90/95’ as close to this point as we can to close this performance gap.
The following graph shows an example of this gap. The system performs most of the time on a level at 22mm flaw size but could actually get close to 2mm.
How to improve the POD?
There are various factors that determine the accuracy of POD. Humans, applications, and equipment form the environment of any industry. In-depth review of all these factors will help you determine and improve POD successfully.
- Understand how you obtained all values.
- Check the procedure and materials used.
- Take into consideration the human factors, application condition, and access.
- Study the equipment sensitivity, resolution, and complexity.
- Take note of assumptions if any.
This process can e.g. show you that your inspection team at a facility is worse than another, because they are using old equipment or there is a very experienced inspector in the other facility.
If you want to learn more about human factors in NDT, check out our article:
What NDT software can improve POD?
We improve the POD by using artificial intelligence (AI). This is a method to minimize human errors and help inspectors finding discontinuities. AI is part of a few technologies that will shape the future of NDT 4.0.
In order to save time and nerves during examination and evaluation, the right tool should be used. Often an interpretation of defects is also not unambiguous, so one asks a colleague for advice. The sentin EXPLORER facilitates the evaluation by automatically analyzing and marking of defects.
Source: https://sentin.ai/en/what-is-the-probability-of-detection-pod-in-ndt/


