ABSTRACT
Increased train speeds and freight loads have contributed to the development of Rolling Contact Fatigue (RCF) and localized damage, such as studs and squats, at wheel-rail contact points. If left undetected, these defects can progress into shelling, where fluid penetration into fatigue cracks accelerates crack propagation and material separation or rail breaks. To address this issue and preserve rail integrity, a non-contact, high-speed, real-time directional eddy current probe for defect inspection has been developed. Initial laboratory testing of the portable prototype, conducted with studs exhibiting RCF-type defects, demonstrated successful detection at increasing speeds. The obtained eddy current results were further validated by ultrasonic testing (UT) to determine the depth profile. Finally, the signal-to-noise ratio (SNR) of the proposed system was estimated for a quantitative evaluation of inspection performance. Subsequent field tests were performed by integrating the technology with a Geismar TC Track Screwdriver on a section of R50 rail on track in the Almaty region of southern Kazakhstan. The system effectively identified spalling, indentations, and shelling defects, with a signal-to-noise ratio exceeding 4.5, showcasing its potential for reliable rail-defect inspection.
1. Introduction
Despite significant progress in other modes of transportation, rail ways continue to serve as a primary means for moving both goods and passengers. Among the critical components of railways infrastructure, the rails bear the majority of mechanical loads. This rail is subjected to mechanical, thermal, and corrosive stresses, which contribute to surface degradation and the formation of multiple defect types. Maintaining high technical standards for railway tracks is therefore essential to ensure safe and efficient operations. This challenge is further intensified by growing demands for increased railway capacity and faster train speeds.
While modern passenger trains typically operate with axle loads below 20 tons [1], recent studies suggest that axle loads up to 30 tons are possible for freight operations [2]. Wheel-induced forces – arising from acceleration, braking, and bending – generate complex shear stresses within the rail structure. These stresses accumulate with repeated train passage, distorting the rail’s microstructure in the direction of travel inevitably initiating crack formation [3]. The rise in train speeds and freight loads has further intensified the occurrence of Rolling Contact Fatigue (RCF) at the wheel-rail contact interface. A study by British Steel and the University of Sheffield [4] examined the influence of surface roughness on RCF in modern rail steels. Their findings revealed that surface roughness – resulting from grinding or wheel turning – increases stress intensity, thereby accelerating crack growth and contributing to RCF failures, even in high-grade rail steels.
In recent decades, various electromagnetic testing methods have been developed to detect and quantify RCF. Examples include the Goldschmidt Trackscan Mira and Sperry "walking stick," which utilize eddy current techniques; the MRX surface condition-monitoring system, which employs magnetic flux leakage; and the Athena RAGA system, which uses electromagnetic field imaging to detect surface-breaking defects. Several of these systems have been adapted for deployment on hi-rail vehicles, enabling broader and more frequent data acquisition [5]. The significant safety risks posed by RCF defects and the necessity for early, automated detection on active tracks are detailed in Ref. [6], along with a comprehensive review of current NDT methods.
In addition to RCF, localized defects such as studs and squats frequently develop on the railhead surface. Squats are typically identified by surface depressions on the railhead, often accompanied by V-shaped cracks [7]. These defects commonly form on tangent track sections due to elevated rolling contact stresses, especially in zones of acceleration, braking, or reduced wheel-rail friction such as wet tunnels. Squats are also prevalent near welded joints, where abrupt changes in surface stiffness exacerbate stress concentrations. If left unaddressed promptly, squat defects may propagate into deeper cracks, ultimately leading to rail fractures. Representative examples of such rail defects observed on track in the Almaty region of Kazakhstan are illustrated in Fig. 1.

Fig. 1. Representative examples of common rail surface and subsurface defects: (a) indentation marks, which may evolve into (b) severe Rolling Contact Fatigue resulting in shelling; (c) surface-breaking defects such as studs; and (d) multiple instances of shelling along the railhead.
Building on this, the study in Ref. [8] explored the formation of squat-like defects originating from surface indentations (see Fig. 1(a)). Such indentations typically result from hard foreign objects being embedded into the rail surface by passing wheels. Isolated indentations suggest a single object was briefly in contact before being ejected, whereas repeated patterns indicate a foreign object lodged on the wheel, producing regularly spaced damage. Over time, these surface deformations can evolve into cracks, posing a significant threat to the rail’s structural integrity.
A more advanced stage of RCF involves gauge corner collapse and the development of deep-seated shelling defects. This phenomenon results from excessive loading on the high gauge corner of the high rail, leading to the detachment of substantial rail fragments. In severe cases, gauge corner collapse may intersect with internal flaws, producing transverse defects and causing rail failure even before complete material separation occurs.
Early detection and mitigation of RCF and localized defects such as squats and studs are essential for prolonging rail infrastructure lifespan. Preventive maintenance techniques, including grinding and milling, can effectively eliminate surface defects before they progress into more severe conditions such as shelling. These challenges are not confined to specific regions, but affect rail and transit systems worldwide. In response, the rail industry has developed a range of non-destructive testing (NDT) methods to detect and quantify RCF, alongside mitigation strategies [9]. However, the current repertoire of NDT techniques for railway track inspection remains limited in scope. In addition to visual inspections, ultrasonic testing is commonly used; however, it faces limitations in detecting specific surface and subsurface defects at high speeds and in accurately assessing their severity and classification [10]. Given the unique characteristics of rail materials and the stringent requirements for detection accuracy and testing efficiency, eddy current testing (ECT) continues to be a preferred method [11].
Numerous studies have explored the application of ECT for detecting RCF and localized surface and subsurface rail defects under static conditions [12–14]. As a result, the potential of ECT for rail in-line inspection has gained considerable attention. However, a key challenge remains: achieving early, reliable, and automated detection of rail defects on operational tracks with high sensitivity. Traditional inspection methods, such as visual assessments, are often time-consuming, labor-intensive, and susceptible to environmental interference from debris and weather conditions, as noted in Ref. [6]. In response, a train-mounted differential eddy current sensor system – the Lindometer – was developed, operating at frequencies of 18 kHz and 27 kHz [15]. While effective in detecting fasteners and missing components from a 65 mm height, its sensitivity is limited for identifying deeper subsurface defects.
To overcome these limitations, a multi-differential EC technique was introduced, operating at 100 kHz in a transmit–receive configuration [16]. This system demonstrated high sensitivity in detecting both longitudinal and transverse cracks, integrating 56 probes to simultaneously inspect the rail head and foot. It successfully identified defects as small as 1.0 mm in depth and 10 mm in length. For comprehensive inspection, the system was combined with ultrasonic immersion and EMAT methods, enhancing its defect characterization capabilities.
The challenges of detecting RCF cracks in high-strength rail steels such as R350HT and R370CrHT, have been emphasized in Ref. [17] where tighter crack fields produce smaller indications. The study employed absolute ECT sensors capable of detecting conductivity variations across a 6 mm working width. Although effective for cracks up to 1 mm deep, further optimization is necessary for reliable detection in dense crack environments typical of high-strength steels. Adding to this, the inadequacy of traditional visual and ultrasonic methods in detecting surface and near-surface flaws, such as head checks and shelling, under operational conditions has been highlighted [18]. To address this, a 16 channel ECT system with plus-point differential sensors was developed.
A complementary approach, the multi-frequency 3D Alternating Current Field Measurement (ACFM) method [19] effectively addresses challenges in rail defect detection by reducing sensitivity to lift-off and speed effects. The system reliably detected defects up to 8 mm deep, offering detailed surface angle and depth assessments.
Despite these advances, ECT remains limited in subsurface crack detection due to its shallow penetration depth. To overcome these limitations [20,21], researchers presented an inspection system based on Motion-Induced Eddy Current (MIEC) [20] and eddy current pulsed thermography [21]. While MIEC systems suffer from reduced sensitivity and signal degradation at high speeds due to trailing effects, thermographic methods struggle to image deeply buried flaws. To mitigate these issues, differential coil sensors were combined with ACFM and Magnetic Flux Leakage (MFL) techniques [20], while [21] introduced a time-domain thermal analysis method based on the square root of temperature drop. Both approaches demonstrated successful detection of buried defects up to 7 mm deep.
Further innovation was presented by Miles et al. [22], who developed a multi-modal hybrid-probe for RCF detection. This system addressed MIEC’s signal degradation at high speeds by integrating electromagnetic and ultrasonic modalities. The hybrid probe employed multi-frequency excitation for high resolution surface and near-surface flaw detection. MIEC enhanced sensitivity via MFL effects, while EMAT enabled non-contact ultrasonic testing. The system achieved reliable detection of defects up to 34 mm deep while maintaining high inspection speeds.
To address signal noise and sensitivity loss at high scanning speeds, a multi-physics coupling approach was proposed in Ref. [23]. This method combined ECT with thermography to simultaneously capture electro magnetic and thermal signals. This integration allows for the detection of buried defects up to 7 mm deep, providing reliable results across various conductive materials even under high-speed scanning (250 mm/s) conditions.
Another study introduced a multi-frequency composite electromagnetic detection technique for high speed rail inspection using a specialized rig [24]. Unlike single-frequency ECT, this approach can gather more comprehensive surface defect information with a lift-off of 1 mm and identify defects at varying depths. The findings revealed that the proposed system can detect: 1) open defects on the turntable rail (depth of 2 mm or more, width of 0.2 mm or more); and 2) buried defects on the subsurface (within a buried depth of 7 mm and above an aperture of 2 mm). These integrated NDT methods have demonstrated superior performance compared to traditional techniques.
In our previous work [11], we evaluated two novel transmit and differential receiver coils against the original probe designed for composite inspection as described previously [25]. This evaluation revealed that a figure-of-eight transmitter coil provided the highest Signal-to-structural Noise Ratio (SNR) for detecting both artificially induced and stud defects in rail samples. However, previous studies did not address the probe’s performance under high-speed conditions or in dynamic field environments – gaps that the present study aims to address. Building upon recent advancements, this study investigates the feasibility and reliability of a directional ECT probe for detecting rail surface and subsurface defects under both controlled high-speed laboratory conditions and real-world field environments. This work addresses key challenges identified in the literature, focusing on the following main innovations: 1) Early detection of studs: a type of squat local damage in rails, achieved by mounting the system on a motorized machine to control speed, aiming to evaluate sensitivity up to 1 m/s and 2) dynamic field measurements: detection of common rail defects, ranging from indentations to severe shelling, using trolley-mounted equipment to advance railroad inspection. This research further refines these methods by focusing on two primary objectives: 1) to examine how the controlled high-speed operation of the cutting machine impacts sensitivity under laboratory conditions to detect induced studs in the rail head and 2) to conduct field tests to assess the sensitivity of the proposed rail health monitoring system to specific defects under varying conditions, including speed and vibration.
2. Materials and methods
The development of an in-line inspection system presents significant challenges, particularly in proving its effectiveness during real-time, on-track inspections. These challenges compounded by stringent safety and performance standards in the railway industry. This section outlines the methodology employed and describes the rail materials and sensor components used in the experimental validation.
2.1. Sensor design
The proposed rail health monitoring system builds on the methodology established in the authors’ previous work [11], with component dimensions shown in Fig. 2. Prior findings demonstrated that the combination of an elongated figure-of-eight transmitter (Tx) and differentially wound rectangular planar receiver (Rx) coils exhibited high sensitivity to both artificial and naturally occurring defects, such as rail studs. The current design enhances this by incorporating a Printed Circuit Board (PCB)-based current source, improving both portability and performance of the directional eddy current (DEC) system.
2.1.1. The transmitter coil
The transmitter coil was fabricated using a manual winding technique as described by the authors in Ref [26]. It consists of 33 turns of 0.2 mm diameter copper wire, wound around two adjacent type 7427213 ferrite cores (Würth Elektronik eiSos GmbH & Co. KG, Germany) in a figure-of-eight configuration, resulting in a total of 66 turns along the nominal magnetic flux path Fig. 2(b).
To determine the coil’s inductance – a critical parameter for system tuning – impedance measurements were conducted at the target operating frequency of 300 kHz. The inductive reactance was calculated using the measured voltage-to-current ratio and the phase angle (θ) between the waveforms. The inductance L was then computed using Eq. (1):


Fig. 2. Schematic design of the directional eddy current probe (adapted from Ref. [11]): (a) planar rectangular receiver layout, (b) transmitter coil dimensions, (c) top-down view illustrating eddy current flow directions; and (d) cross-sectional view (A-A′) of the fully assembled probe.

where, XL = Z⋅sin θ = vⅈ ⋅sin 90◦ is the inductive reactance of coil impedance, and ω = 2⋅π⋅3⋅105 Hz, is angular frequency.
The measured inductance was 352 μH. Using this value, the coil’s self-capacitance (Cs) was estimated, and the self-resonant frequency was determined by applying a 20 V peak-to-peak sinusoidal voltage and adjusting the frequency until the current waveform through the coil reached a null. The resonant frequency (f0 ) was found to be 4.15 MHz. These results obtained are summarized in Table 1.
2.1.2. The receiver coil
The receiver consists of two identical planar coils, each with 12 turns, fabricated on a double-sided PCB. These coils are connected in a series-opposing configuration, which effectively cancels the induced electromotive forces (EMFs) from the primary magnetic field, enhancing sensitivity to local field disturbances caused by defects.
The inductance of the receiver coils was measured at 300 kHz using the method described in Section 2.2.1. The inductance was found to be 2.64 μH. Additional parameters, including the quality factor (Q), AC loss resistance, and self-resonant frequency (20.3 MHz), were determined using a network analyser (TE3001, Trewmac Systems, Australia). To achieve electrical resonance at the desired operating frequency of 808 kHz, 14.7 nF tuning capacitors were added, as recommended in Ref. [27]. Further design details are available in Ref. [11].
A voltage-controlled Howland current source was developed to supply a stable 24 mA RMS to the transmitter coil, ensuring consistent performance at an operating frequency of 2 MHz. The circuit is powered by a ±12 V dual supply and includes integrated protection features against reverse polarity and voltage transients. It has a compact design, combined with robust high-frequency performance, which makes it particularly well-suited for ECT applications, especially in the dynamic inspection of rail infrastructure.
2.2. Method
Prior to field deployment, a series of laboratory experiments were conducted to validate system performance under controlled conditions. Based on previous findings [11], optimal sensitivity was achieved at 0.3 MHz with a 1 mm lift-off. These parameters were adopted for dynamic testing.
To assess the system’s defect detection capability at speeds up to 1.0 m/s, the probe was mounted on an Eastman Eagle-S125 cutting machine (see Fig. 3i a). For comparison, the FILUS EC-1 single rail eddy current trolley, manufactured by ETher NDE Ltd., UK can operate at speeds up to 1.39 m/s. Consequently, the system conducted scans on a rail sample extracted from the field, which contained authentic rail defects (studs), at ten discrete speeds ranging from 0.1 to 1.0 m/s in 0.1 m/s increments. The sensor’s performance was assessed by measuring the differential voltage (in Volts) and the root-mean-square (RMS) of background structural noise, with a focus on detecting studs at various speeds. For each speed, the SNR was calculated using:

where Vmax and Vmin are the peak differential voltages from the defect zone, and RMS(N) is the root mean-square of the background response in non-defective regions.
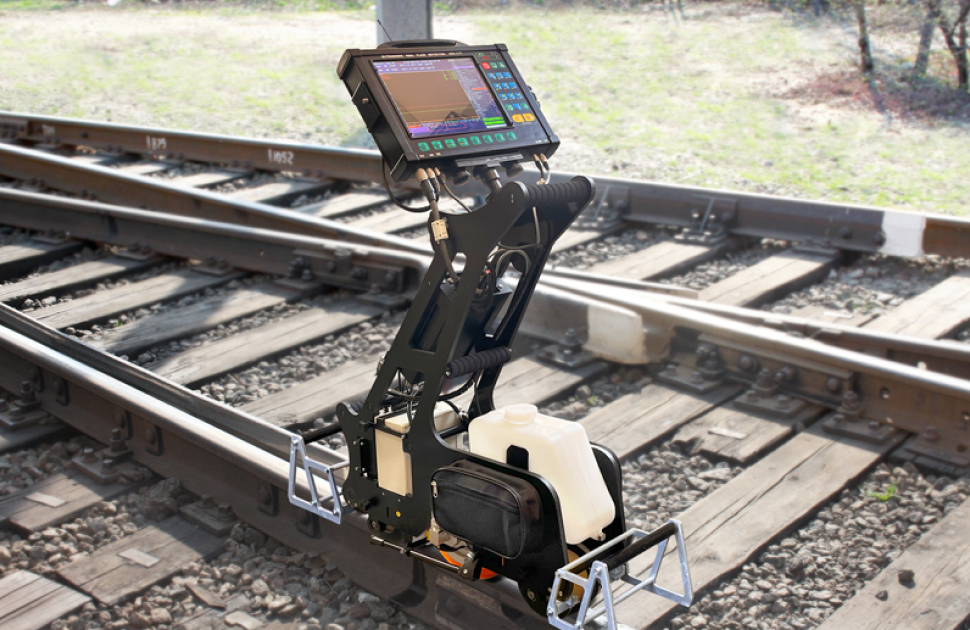
For the field validation, the portable DEC system was integrated with a Geismar TC Track Screwdriver. The block diagram and an actual photograph of the proposed system are presented in Fig. 3iib. Both static and dynamic tests were conducted on operational track segments. As in the laboratory tests, SNR analysis was used to quantitatively evaluate the system’s ability to detect real-world defects, including indentations, spalling, and shelling, under varying operational conditions such as vibration and lift-off.
2.3. Measurement set-up
Fig. 3 presents both configurations: Fig. 3i a-b shows a schematic and photograph of the probe mounted on Eastman’s Eagle-S125 composite cutter, used as a motorized scanner. Fig. 3iia-b illustrates the field test set-up, including a schematic and a smartphone image of the equipment in use. Both experimental set-ups (see Fig. 3) include a handyscope (TiePie Engineering), which was used to generate a sinusoidal excitation signal. This signal was fed into a Holland current source circuit housed within the DEC probe box enclosure, powered by a DC supply (X470, Accuron). One output from the current source delivered a stable excitation current to the transmitter (Tx) coil, while another output provided a reference voltage to the Handyscope for comparison with the received signals. Data acquisition and real-time post-processing were performed using a custom MATLAB script, interfaced with the handy scope. To aid understanding of the high-speed eddy current inspection process, a video demonstration is provided in Supplementary Material 1, offering a detailed visual explanation of the experimental procedure.
Supplementary data related to this article can be found online at: https://doi.org/10.1016/j.ndteint.2025.103532
It is important to note that the lift-off distance – the gap between the probe and the rail surface – was set to 2 mm for both laboratory and field tests. This value was chosen to accommodate surface roughness. How ever, during field testing, mechanical vibrations and manual handling of the screwdriver introduced variability in lift-off. The differential coil architecture of the proposed system effectively mitigates the impact of such variations, preserving SNR integrity.

Fig. 3. Experimental set-up: (i) High-speed eddy current test: (a) schematic diagram of attaching the developed system to Eastman’s Eagle-S125 head; (b) actual photograph; (ii) Field dynamic test: (a) schematic diagram; (b) smartphone photo of the field test setup.
2.4. Materials
Fig. 4 illustrates the rail sample (extracted from the track) used in the laboratory tests. The sample, extracted from an operational track, measured 235 × 75 × 20 mm and contained visible surface-breaking defects (studs) between 81 mm and 116 mm, as indicated by dashed lines(see Fig. 4). These defects included a prominent ‘U’-shaped crack.
Before sectioning for micrographic analysis, the sample was coated to enhance surface crack visibility (see original sample in Fig. 1(c)). This coating increased the lift-off distance slightly. The carbon content of the molten rail material ranged from 0.87 % to 0.97 % by mass.
Field testing was performed on P50-type high-carbon alloy steel (carbon content: 0.65–0.77 %), which exhibited localized damage such as indentations and severe shelling due to RCF. The mechanical properties of the P50 rail steel are summarized in Table 2.
To characterize internal defects, phased-array ultrasonic testing (UT) was conducted in an immersion tank as is shown in Fig. 5. A 15 MHz Imasonic 1D phased-array probe with 64 elements (0.21 mm pitch) was used to perform the scan. The high frequency enabled detection of small fatigue cracks, with a longitudinal wavelength of around 0.39 mm in steel.
The sample was positioned upside down on aluminium supports to elevate it from the tank base and ensure horizontal alignment. The probe was placed 8.55 mm above the scanning surface and aligned along the y-axis (see the scanning coordinate system in Fig. 5), optimizing resolution in that direction. A scanning grid of 40 × 15 points (1 mm spacing) was used.
The phased-array probe was controlled using a commercial Micropulse MP5PA array controller (Peak NDT, Ltd., Derby, UK), which enabled full matrix capture (FMC) of time-domain signals. The device is equipped with 64 parallel transmission and reception channels, which allows the acquisition of the full set of time-domain signals from all possible transmitter-receiver pairs, known as FMC. Data processing was performed in MATLAB using an in-house Total Focusing Method (TFM) algorithm [28], with longitudinal wave velocities of 1480 m/s in water and 5900 m/s in steel.

Fig. 4. The sample prepared for high-speed laboratory inspection, featuring a sectioned rail top with stud defects. Insets show the actual defect location and dimensions determined using phased-array ultrasonic testing.

Fig. 5 includes a 3D rendering of the internal defect, while Fig. 4 overlays the top view of the UT scan on the sample. Zoomed-in insets of both the top and side views are also shown in Fig. 4. The blue regions represent reflections from boundaries or internal flaws. The existence of an internal crack has caused a discontinuity in the detected boundary due to the scattering of the ultrasound waves from the surface of the crack in different directions; hence, the shape and dimensions of the crack can be deduced from the shape of the discontinuity in the detected boundary. While the visual inspection suggested that the defect starts at around 81 mm from the left side of the sample, it can be clearly seen in the top view of the UT image that the defect extends internally to reach at least 73 mm from the sample’s left edge. The side view of the UT image shows the depth of the internal crack which reaches at its deepest detected point (of a clear crack surface) a value of around 8.6 mm from the sample’s highest surface point. It should be noted here that deeper defects might also be detected in the image, but there is no clear evidence that these points of high intensities belong to a crack surface. Such points might correspond to possible crack tips or voids, or even some imaging artefacts. More detailed cross-sectional views of the scanned region, at each x-position, can be found in Fig. A1.1 in Appendix A1.

Fig. 5. Immersion-tank setup for phased-array ultrasonic scanning with an inset showing the 3D image of the internal defect obtained using the TFM imaging technique. Both the probe and the sample are placed underwater, which is more visible in the photo taken from the front of the tank.

Fig. 6. Example plots comparing the obtained eddy current sensor signals at different speeds: (a) 0.01 m/s; (b) 0.5 and 0.6 m/s.
3. Results
3.1. High-speed eddy current testing laboratory measurements
To ensure precise probe positioning during high-speed inspection, the Eagle-S125 composite cutte (Eastman Machine Company, USA) was employed. This device offers a positional accuracy of ± 0.381 mm and supports scanning speeds of 1.52 m/s. The rail head was sectioned to a depth of 20 mm to fit the machine’s table, and a consistent lift-off distance of 2 mm was maintained throughout the study. A custom 3D-printed L-shaped fixture was used to secure the probe to the cutter head, as shown in Fig. 3(b)
3.1.1. High-speed sensor signal and inspection challenges
Initial measurements were conducted at a low speed of 0.01 m/s to capture baseline sensor signals using real-time post-processing in MATLAB R2024a. A demonstration video (Supplementary Material 1) illustrates the scanning process and highlights the detection of anomalous signals corresponding to rail studs. An example signal trace is shown in Fig. 6(a), where horizontal dashed lines indicate twice the RMS noise threshold, and vertical dashed lines represents the defect zone. For details on the high-speed ECT post-processing and SNR estimation methods used in this study, refer to Appendix B1. The SNR for this case was calculated as 12.5. However, increasing the speed to 0.1 m/s significantly reduced the time window available for signal acquisition, making it more difficult to distinguish between defective and non defective zones for accurate SNR assessment. Consequently, for higher-speed inspections, the real-time monitoring function was switched off. Future work will investigate optimization methods for high-speed applications of real-time inspection using the existing script. It should be noted that even after disabling the post-processing option, the measurement results at higher speeds (e.g., 0.4–0.5 m/s) showed distortion in the signal from its original shape. To illustrate this issue, Fig. 6(a) presents the time-trace results obtained at 0.01 m/s, while Fig. 6(b) shows results at 0.4 and 0.5 m/s. This distortion may limit the use of such data for machine learning applications. Raw eddy current data across speeds from 0.1 to 1.0 m/s are presented in Fig. 7.
3.1.2. Signal-result analysis and SNR evaluation
For each speed, three repeated scans were performed. The RMS noise was calculated for each dataset to quantify background signal variability in the extracted eddy current data, specifically within time intervals associated with positions along the X-axis for each scan, as detailed in Fig. 7. The RMS noise values provide insight into the background noise at different speeds, which is crucial for understanding the reliability of defect detection. The differential voltage between the two receiver coils served as the primary defect signal metric (see vertical dashed line in Fig. 7). However, relying solely on the signal voltage can be challenging for interpretation without assessing the response from the coherent structural response of sound areas. While signal amplitude varied slightly with speed (ranging from 0.0028 to 0.0053 V), the RMS noise had a more pronounced effect on SNR (see Fig. 8).
SNR values were computed using Eq. (2) and plotted with error bars in Fig. 8. The results show a general decline in SNR with increasing speed. The higher SNR of 6.5 was recorded at 0.1 m/s, while the lowest value of 4.5 occurred at 1.0 m/s. These findings confirm that although eddy current inspection remains viable at higher speeds, detection clarity diminishes, necessitating further optimization for real-time applications.
The signal trace at 0.5 m/s (see Fig. 6(b)) shows additional detail that may aid in characterizing damage severity – potentially exceeding the resolution of ultrasonic testing alone. Similar research in Ref. [29] has demonstrated the benefits of combining eddy current and ultrasonic methods. While ultrasonic testing is more effective for sizing deeper defects, it struggles to detect RCF-type cracks shallower than 4 mm [10]. In contrast, ECT is more sensitive to surface-breaking defects such as squats, as demonstrated in Fig. 7. The high-speed ECT results confirm the system’s capability to detect squat-type defects with reasonable sensitivity. Field tests on additional defect types further support the system’s practical applicability.

Fig. 7. Raw eddy current data collected at inspection speeds ranging from 0.1 to 1.0 m/s.

Fig. 8. Sensitivity evaluation of the proposed eddy current system for high-speed test: a) SNR, and b) separate contributions of signal and noise RMS values.
3.2. Dynamic eddy current testing: field measurements
This section presents the results of field experiments conducted using the proposed portable rail health monitoring system. The objective was to evaluate the system’s sensitivity to various defect types under real-world conditions, including variable scanning speeds and mechanical vibrations.
3.2.1. Signal response of the proposed system
An exemplar signal was recorded as the system scanned over three spalling defects. Photographs of the defective zones are provided in Fig. 9(a), while the corresponding sensor signal is plotted in Fig. 9(b). The scan begins over a severely spalled region, covering a time window from 0 to 4.2 s. A positive differential voltage peak is observed when the first receiver (Rx) detects the defect. As both Rx coils pass over the center of the defect, the signal drops to near zero, followed by a negative peak as the second Rx coil senses the same defect. This symmetric response is characteristic of in eddy current systems.
Vertical dashed lines in Fig. 9(b) mark the signal responses corre sponding to the three defects, while the non-defective region (4.2–9.2 s) shows no significant signal. A zoomed-in view of each signal component is provided in Fig. 9(c). A horizontal dashed line represents twice the RMS noise threshold, above which signals are classified as defects.
The second defect produced a similar symmetric response, while the third exhibited an "M"-shaped signal due to multiple overlapping defects – consistent with observations in Ref. [11].

Fig. 9. Example probe signal during inspection: (a) P50 rail grade with defects, (b) raw scan data obtained during dynamic testing, and (c) time-based sections showing individual signal contributions.

Fig. 10. Raw eddy current data obtained from three spalling defects.

Fig. 11. Sensitivity evaluation of the proposed eddy current system in relation to defect depth.

Fig. 12. Measurement results of two indentations inspected at varying system speeds.
3.2.2. Spalling detection and SNR evaluation
Six repeated scans were performed over three spalling defects using the setup shown in - Fig. 3iia. In all cases, the signal responses exceeded the noise threshold, confirming successful detection (see Fig. 10). Signal variations were observed during scanning: in scan 1, the second spalling defect generated two asymmetrical positive peaks, while in scan 4, the third defect exhibited a distorted ’M’-shaped response, likely caused by a high impulse during manual scanning.
Despite these variations, the system consistently detected all spalling defects. The starting points of each detected spalling defect varied along the time trace, primarily due to inconsistencies in the manual hand push velocity during scanning. Variations in signal timimg is evident in scans 2, 4, and 6, where the time trace ends slightly before the 20-s mark, allocated for testing this rail section.
The SNR for three spalling defects were plotted against their micrograph-measured widths (4.6 mm, 5.0 mm, and 7.7 mm) in Fig. 11., The variations in SNR can be attributed to the uncontrolled velocity of the measurement system. Despite these deviations, the overall results demonstrate that the SNR values exceeded the industry-accepted threshold of SNR >3, confirming satisfactory performance of the system. The structural variation of RMS noise, multiplied by two, is plotted as a horizontal line in Fig. 11. This indicates a significant improvement compared to previous research results [11], where the rail sample with studs showed approximately a thousand-volt response in the non-defective zone. The RMS noise response from the non-damaged rail (refer to the right Y-axis in Fig. 11.) at P50 demonstrates that the improved current source circuit significantly reduced the noise level, enhancing the overall SNR, enhancing overall SNR performance compared to earlier studies [11,25].
3.2.3. Indentation detection
Two indentations were detected and analyzed at different scanning speeds. The first indentation was scanned at low speed to capture detailed signal characteristics (see Fig. 12). The second indentation was scanned at a higher speed by pushing the track screwdriver faster. Micrograph measurements showed diameters of 6.1 mm and 7.4 mm, respectively, with a 10 mm spacing between them. This comparison provides valuable insights into how scanning speed influences signal shape and defect detection. The estimated SNR for the first detected indentation (between 2 and 7.5 s in Fig. 12) was 4.65, while the second indentation had an SNR of 7.1, with the RMS noise multiplied by two measured at 0.8 V. These results demonstrate that scanning speed influences signal shape and SNR, with higher speeds potentially enhancing signal clarity for certain defect types.

Fig. 13. Measurement results of severe shelling.


Fig. 14. New handheld device prototype with high-quality video recording option: a) description of the front panel; b) general dimensions of the inspection system.
3.2.4. Multiple shelling rail damages
During scanning over multiple shelling defects, the sensor produced a composite signal rather than distinct responses for each defect as shown in Fig. 13. This overlap was likely due to the close proximity of defects, which caused signal interference. To address this, the initial portion of the scan (0.4–8.5 mm) over a non-defective zone was used to estimate RMS noise. The remaining portion was used to assess shelling severity. The SNR values across scans 1 to 5 as 10.6, 10.4, 7.0, 10.4, and 10.3, respectively. The RMS noise threshold ( × 2) was approximately 1.46. These results confirm the system’s high sensitivity to severe shelling. Future improvements may include integrating a high-speed digital camera for real-time defect localization and cross-referencing with ECT data. A demonstration video (see Supplementary material 2) illustrates the experimental scanning process in the field, showcasing the measurement procedure with real-time post-processing and the detection of anomalous signals indicating rail defects.
Supplementary data related to this article can be found online at
https://doi.org/10.1016/j.ndteint.2025.103532
3.3. Summary of high-speed and field SNR results
These results (see Table 3) confirm that the proposed directional EC system is capable of reliably detecting a range of surface-breaking rail defects under dynamic field conditions. The system consistently achieved SNR >3.8, meeting industry standards for defect detection sensitivity.
A quantitative comparison of inspection system parameters – SNR, testing speed, detection depth, and resolution for RCF-type defect detection – is presented in Table 4. As shown in Table 4, although the proposed system was validated at relatively low speeds, it outperforms other systems in detecting deeper defects.
3.4. Limitations and challenges
High-speed inspection revealed several limitations in the current MATLAB-based data acquisition and processing script, particularly when capturing eddy current data from a 235 mm rail sample. As measurement speed increased, the script struggled to maintain real-time performance. To address this, future works will focus on optimizing FFT calculations using more efficient algorithms and ensuring that the number of FFT points is a power of two. Additionally, reducing the sampling frequency to the minimum required for adequate resolution and shortening the record length will help minimize data processing time. To further enhance performance, parallel processing techniques using MATLAB’s Parallel Computing Toolbox or GPU acceleration will be explored. These improvements aim to enable simultaneous data acquisition and processing, which is essential for real-time high-speed inspection.
The proposed system has demonstrated strong capabilities in detecting a wide range of rail defects – from small indentations to severe shelling – at speeds up to 1 m/s in both laboratory and field settings. However, while ECT provides reliable detection, localizing the exact position of defects remains a challenge. For instance, as shown in Fig. 13, the system successfully detected multiple shelling defects, but interpreting overlapping signals requires either advanced signal processing or integration with high resolution video recording. To address this, a new handheld device prototype has been developed (see Fig. 14), featuring a Raspberry Pi Camera with a 12.3 MP sensor for real-time video capture. This device is optimized for planar scan speeds below 0.5 m/s and balances hardware complexity, cost, and adaptability for diverse user needs.
Field observations from the Almaty rail section also motivated a redesign of a previously patented utility model [31] for detecting defects in complex shaped conductive materials. The current probe is optimized for flat rail surfaces, but may miss defects at the gauge corner. Future iterations will include a directional ECT probe tailored for gauge corner inspection.
Field testing also highlighted the importance of controlling both speed and vibration to ensure that sensitivity correlates accurately with these parameters. However, manual operation introduced uncertainties in both parameters. This necessities the need for recording the actual scan speed recorded using encoder. Also the lift-off fluctuations should be quantified using a laser displacement sensor. These uncontrolled variables are critical for practical deployment. Moving forward, future work will focus on validating the system’s effectiveness on more advanced rail steel defect samples using a high-speed inspection rig developed at the University of Sheffield, UK. Additionally, further tests are planned at the University of Sheffield, where the inspection system will be integrated into a specialized inspection handcart. This future research will emphasize detecting squats and other localized types of rail damage.
The extensive scan data collected during field trials also underscores the need for automated defect, especially in severely damaged zones. Welded rail joints present additional challenges due to surface roughness and the orientation of discontinuities. Small cracks aligned with the eddy current flow often go undetected [32]. This limitation can be addressed by applying rotational ECT, which generates uniformly distributed eddy currents and improves sensitivity to weld-related defects. Similar approaches have been reported in Refs. [33,34]. Our team is currently developing a high-sensitivity ECT probe for weld inspection in collaboration with Yokohama University, Japan. However, this design requires a single receiver coil, which is sensitive to lift-off variations. Innovative mechanical solutions will be needed to maintain consistent lift-off during hand trolley inspections.
Given the limited availability of diverse rail steel samples, this study focuses on two materials: (1) a high carbon-content, field-damaged rail section featuring rail studs, and (2) P50-type steel, which is widely used in Kazakhstan. Future work will expand testing to include diverse rail steels and weld geometries in collaboration with a rail manufacturer. Additionally, deep learning models will be trained using large datasets—including defect and rail joint data from Kazakhstan—to enable automatic classification of defective and joint sections.
4. Conclusion
This study presents a portable directional eddy current (DEC) system for high-speed rail defect detection, validated through both laboratory and field experiments. The system was tested on various defect types, including studs, indentations, spalling, and shelling, under dynamic conditions. Characterizing these damage types is essential for demonstrating the effectiveness of the developed portable directional eddy current system in detecting rail flaws at their early stages. The results indicate that the proposed system can be effectively employed in real-time for detecting both surface and subsurface defects. Key findings include.
• Stud detection:
The system successfully detected stud defects in high-carbon rails at speeds up to 1 m/s, identifying defects with depths of approximately 8.6 mm and widths of ~43 mm, achieving an SNR of more than 4.5.
• Indentations and shelling:
The system demonstrated reliable detection of both early-stage indentations and severe shelling, with SNR values exceeding 3.8 in field conditions.
• Spalling and multiple defects:
Spalling defects were consistently detected across multiple scans, and the system showed the ability to respond to complex damage patterns, although overlapping signals require further interpretation.
Overall, the proposed system offers a promising solution for real-time, non-contact rail inspection. Future work will focus on enhancing localization accuracy, integrating video-based verification, and expanding testing to include welds and advanced rail materials.
CRediT authorship contribution statement
Meirbek Mussatayev: Writing – original draft, Visualization, Supervision, Software, Methodology, Investigation, Funding acquisition, Formal analysis, Conceptualization. Mohammad Ali Fakih: Validation. Mark Fitzgerald: Resources. Roger Lewis: Writing – review & editing, Resources. Abay Beisenbekov: Formal analysis, Data curation. Gulsim Rysbayeva: Visualization, Formal analysis. Berik Rysbayev: Formal analysis, Data curation.


