


Abstract
A reliable assessment of bridges requires a comprehensive digital twin model (DTM) that tracks structural behavior throughout the bridge life cycle. The DTM integrates a data model for two-way interoperability with finite element analysis, facilitating the management of key performance indicators for both individual bridge members and the overall bridge system. The DTM is designed with active updates to geometric models and linked analysis data to ensure effective performance management. In this study, the proposed DTM was validated by testing a deteriorated prestressed concrete (PSC) girder from an actual bridge, focusing on its key performance metrics. In the case of PSC girders, what-if simulation concept is applied to assess the corroded strands case for analyzing the flexural strength. Additionally, a methodology for applying the DTM to the bridge system, using pre-simulated data from load tests, is introduced. This approach replaces the finite element model with a surrogate model that functions as an influential surface for various dead load cases. The data accumulated in the DTM serve as valuable indicators for ongoing bridge maintenance and management.
1. Introduction
The prestressed concrete (PSC) structure is one of the most widely used bridge structures worldwide owing to its efficiency and economy. The most important factors in the maintenance of PSC structures are the time-dependent behavior caused by the prestressing stress introduced by the prestressing tendon and the reduction in the load-carrying capacity due to corrosion of the tendon, which cannot be observed with the naked eye. This is particularly important because the inspection of bridges relies mostly on visual inspection, making it difficult to understand the actual safety factors of the main members and of the bridge system. Problems such as corrosion of the tendon are not detected at an early stage, resulting in the continuous occurrence of tendon rupture and, eventually, the collapse of bridges [1–4]. These collapse accidents have raised the alarm among PSC bridge managers that there is an urgent need for a method to evaluate the residual performance of bridges in service.
The most direct way to investigate the soundness of tendons is to check their condition directly with an endoscope camera, but this would cause damage to the structure; therefore, research studies have been conducted on how to measure the residual stress of internal tendons through nondestructive testing [5,6]. However, these assessments require special equipment for each investigation and take a considerable amount of time, and thus, although these methods can be used for areas where damage is clearly suspected, they are difficult to apply to managing all of the tendons of a bridge. Studies have been conducted on how to indirectly estimate changes in the conditions of PSC bridges by analyzing data from sensors attached to the bridges to allow their structural health to be continuously evaluated [7–9]. These studies proposed algorithms for detecting damage and its location based on the changes in the natural frequency and mode of the bridge, which are known to occur whenever damage occurs in the bridge, and verified these methods in a laboratory environment. However, these algorithms can be used only when the factors involved in the free vibration of the test body are clear, such that changes in the natural frequency and mode are distinct, and are therefore difficult to apply to actual bridges owing to the complexity of the environment and traffic load.
Recently, the idea of applying machine learning and artificial intelligence (AI) technologies to solving these engineering difficulties has been introduced [10–12]. These methods have reflected various damage scenarios in finite element analysis (FEA) to derive result data and eventually led to the proposal of an AI-based technology designed to determine even very small differences in a structure. Accordingly, it has been shown that this method can determine not only the location of damage but also the degree of the damage; however, the reliability of these research results depends on whether the finite element (FE) model properly reflects the actual behavior of the structure.
For a bridge assessment method to be feasible for practical application and produce reliable assessment results, it would require information that can clearly identify the current status of the target structure. To this end, it would be necessary to develop a system that not only is able to accumulate bridge inspection information and manage its history but also is able to immediately check its status. In this regard, research is being actively conducted worldwide on how to utilize digital twin models (DTMs) for structural maintenance. A digital twin continuously receives response data from an actual structure through model updates and constructs a digital model that exhibits the same behavior. From this functionality, it is expected that digital twins can be utilized for evaluating and predicting structural conditions.
Shim et al. [13] proposed a schema for organizing bridge maintenance data and linking it to DTMs, along with a component-level inventory system that integrates drone-based scans and image-based damage detection. Ye et al. [14] further advanced this direction by combining monitoring data with analytical models to assess structural conditions and performance, presenting the process as structural identification that enables quantitative evaluation even by non-experts. Yuet al. [15] developed a digital twin-based hybrid structural health monitoring method by coupling sensor data with finite element models, which was applied to fatigue damage assessment of orthotropic steel decks in cable-stayed bridges. Mahmoodian et al. [16] focused on infrastructure-level applications and introduced a real-time IoT-based digital twin framework to enable predictive maintenance through semantic data modeling. Jeon et al. [17] proposed a DTM architecture that incorporates key performance indicators (KPIs) with maintenance data, establishing a prescriptive maintenance system for prestressed concrete bridges. Building on these developments, Roh et al. [18] defined a baseline digital twin model (B-DTM) as a reference framework and proposed a model updating method using load test data and stiffness constraints to reduce uncertainty, thereby enhancing its applicability to real-time digital twin implementation.
Kang et al. [19] and Dang et al. [20] suggested methods that utilize surrogate models for structural identification. Because it is highly unlikely for bridges to actually exhibit abnormal behavior because of damage for various types of damage, making it difficult to observe for and obtain essential data, the relevant data can instead be obtained from the behavior of an analysis model in a virtual scenario. In those studies, the main factors that would affect the FEA model were selected through correlation analysis, and the input data for the factors and the output data of the FE model were defined as a dataset for data augmentation, which was then used for learning the surrogate model. As a result, those studies suggested a method in which a surrogate model built for various scenarios could be used to evaluate bridges in real time by replacing the costly FE model.
Additionally, a number of studies have suggested methodologies for increasing the fidelity of analysis models, although they do not completely go through a structural identification process. For example, Febrianto et al. [21] proposed a statistical FE method that compensates for the difference between the actual structure and the analysis model through statistical processing of the uncertainty of sensor data, while Dan et al. [22] constructed a weigh-in-motion system using light detection and ranging (LiDAR) and a camera and devised a simulation model that reflected the actual load characteristics.
To characterize the local behavior of structural members, LEE et al. [23] developed a probabilistic approach aimed at estimating the mechanical properties of steel strands affected by corrosion. This approach effectively tackles the complexities associated with strand geometry, corrosion mechanisms, and various uncertainties. By combining FEA, surrogate modeling based on Gaussian process regression (GPR), and Monte Carlo (MC) simulations, the method enables prediction of the ultimate strength and strain of deteriorated strands. In a subsequent study, LEE et al. [24] introduced a computationally efficient multi scale analysis framework to assess the probabilistic behavior of PSC girders, explicitly accounting for the effects of pit corrosion in prestressing steel.
The studies on DTM for bridge maintenance discussed herein thus far used model updates and various methods to build high-fidelity models, acquired data using sensors installed on bridges, and performed model calibration. However, this approach requires a sophisticated FEM model and a high-level sensing system, which is difficult to build for most bridges owing to its high cost. In addition, in current maintenance practices, bridge inspections are performed and recorded on a memberby-member basis, and thus, the DTM must be built also on a member-bymember basis to utilize the inspection data [16]. Therefore, this paper presents a method for building a DTM on a member-by-member basis and on a bridge-by-bridge basis, thus allowing the DTM to be built universally, and proposes a way to increase fidelity. In Europe, performance indicators have been established to ensure effective bridge asset management, and asset quality management plans have been formulated by comparing these indicators with performance targets during maintenance processes. Bridge performance indicators are specifically provided at both the component and system levels and expressed in various qualitative and quantitative formats [25]. The proposed approach includes methods for measuring and evaluating these indicators through inspection. This paper introduces a methodology for selecting and utilizing key performance indicators (KPIs) for bridges and their members to efficiently construct their DTMs and apply these models for maintenance, as shown in Fig. 1. KPIs are managed and updated throughout their life cycle and serve as key indicators for assessing and predicting the condition of the structure. For maintenance, visual inspection and load test, acquiring the data from visual inspections on the structures are executed. With inspection data, we propose a method to assess the local behavior using the what-if simulation. Also, we develop the surrogate model which is mapped into influential surface model which means the various load cases. Using this KPI-based methodology, we introduce an approach that enables the integration of existing PSC-I bridge management methods with DTMs. The proposed approach was validated through a case study involving an actual bridge.
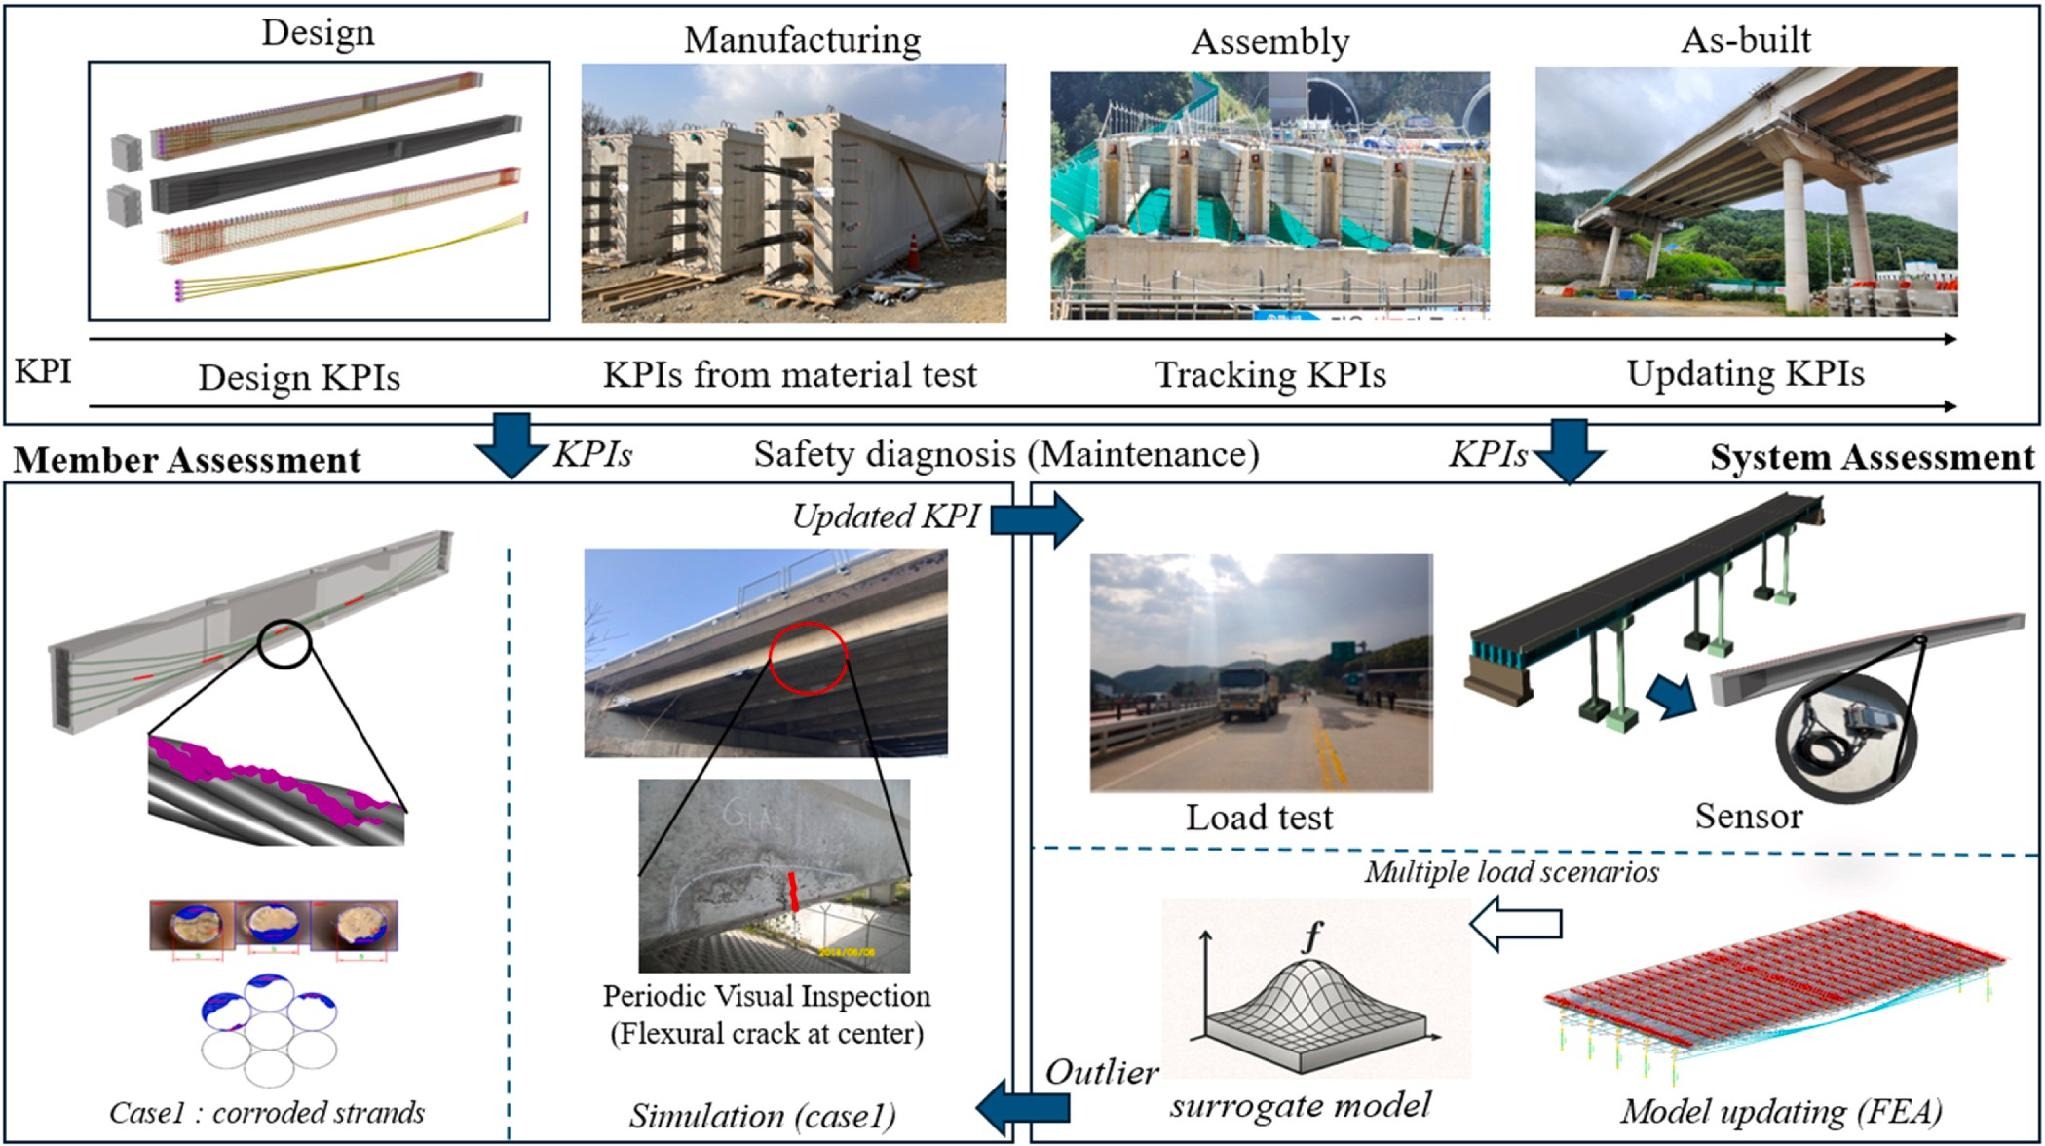
Fig. 1. Concept of the DTM structures using KPI and what-if simulation.
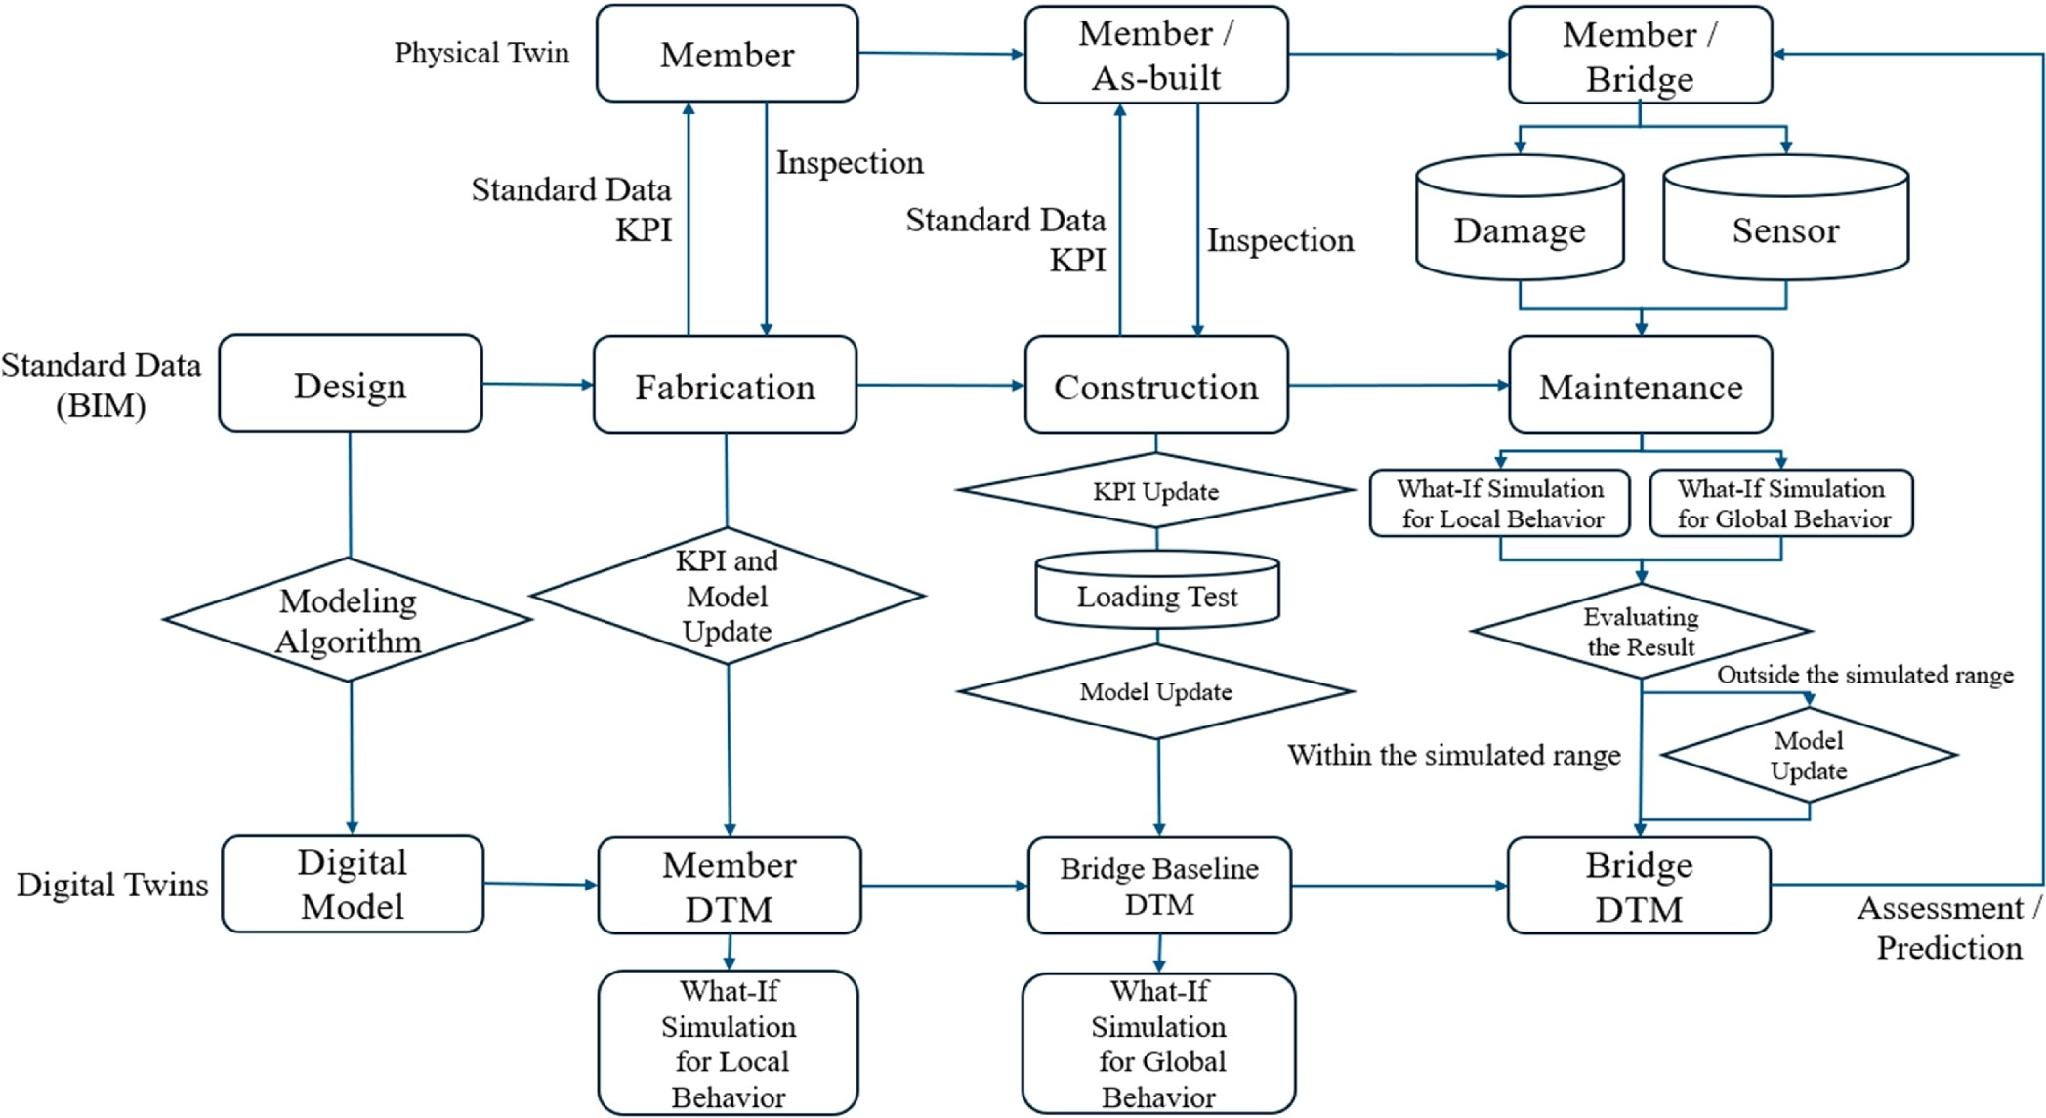
Fig. 2. Establishment of KPI-based digital twin model for the PSC bridge.
2. Digital twin for the PSC bridge
Fig. 2 shows the process of constructing the DTM of a PSC-I bridge by considering the KPIs. The construction of a digital twin begins when the information generated based on the calculations in the design process is implemented as a digital model using a modeling algorithm. This process is in the same context as digitizing design information using building information modeling (BIM) and includes a subprocess for reflecting various errors or data changes that occur after the member manufacturing process. Subsequently, in the actual member manufacturing process, a member-unit DTM is generated by constructing a physics based model linked to the digital model. This physicsbased model is used to perform simulations that reflect the various states of the member. After the member manufacturing process, a process for updating the physics-based model by reflecting the measured actual deformation and material information is required, and each main member becomes a performance indicator standard for itself and, simultaneously, a KPI-based member DTM that serves as an indicator for the performance evaluation of the bridge system.
Each member DTM is federated to build a bridge-system unit DTM. At this point in time, models such grillage models, FE models, etc., can be utilized for the federation of the bridge physics-based model, and the information of the updated member-unit DTM must be appropriately delivered according to the needs of the user. The reasons for defining the digital twin of the PSC bridge as a federation of the digital twins for its members are that 1) bridge maintenance work is performed for each member unit, 2) members are individually manufactured and assembled on site, and 3) to update the integrated system unit, a reliable member evaluation must be performed for each member, reflecting the history of the manufacturing characteristics of that member. In particular, the prestress introduced into a PSC girder can be evaluated by observing the girder-unit digital twin built at the time of member manufacturing and the deformation measured after manufacturing. Even if the member DTM is calibrated through model updates during the manufacturing process, the bridge-unit behavior may differ from the actual behavior owing to secondary members, support conditions, modeling errors, material reliability, etc. Therefore, to build a baseline model for future simulations, it is necessary to update the bridge-unit physics-based model once again, which can be accomplished through comparison with the results of field-loading tests. However, the updated dimensions and materials in the member DTM are not considered as updating variables. Rather, the updated bridge DTM becomes a way to numerically express the overall structural behavior and load distribution, whereas behavior changes appearing in member DTMs become representative of the entire bridge behavior, depending on the degree of the changes. For example, significant damage to a member causes significant changes in the behavior of the member DTM (e.g., unexpected deflection and flexural cracks), which can then be recognized by bridge managers as an indication that damage has occurred on the bridge. Therefore, the baseline DTM can play a role in revealing the state of the system until the bridge behavior changes outside the range of prediction. For this purpose, a surrogate model, which would be replacing the heavy FEA model, maybe utilized in the maintenance phase with a BIM model, which can be deflected.
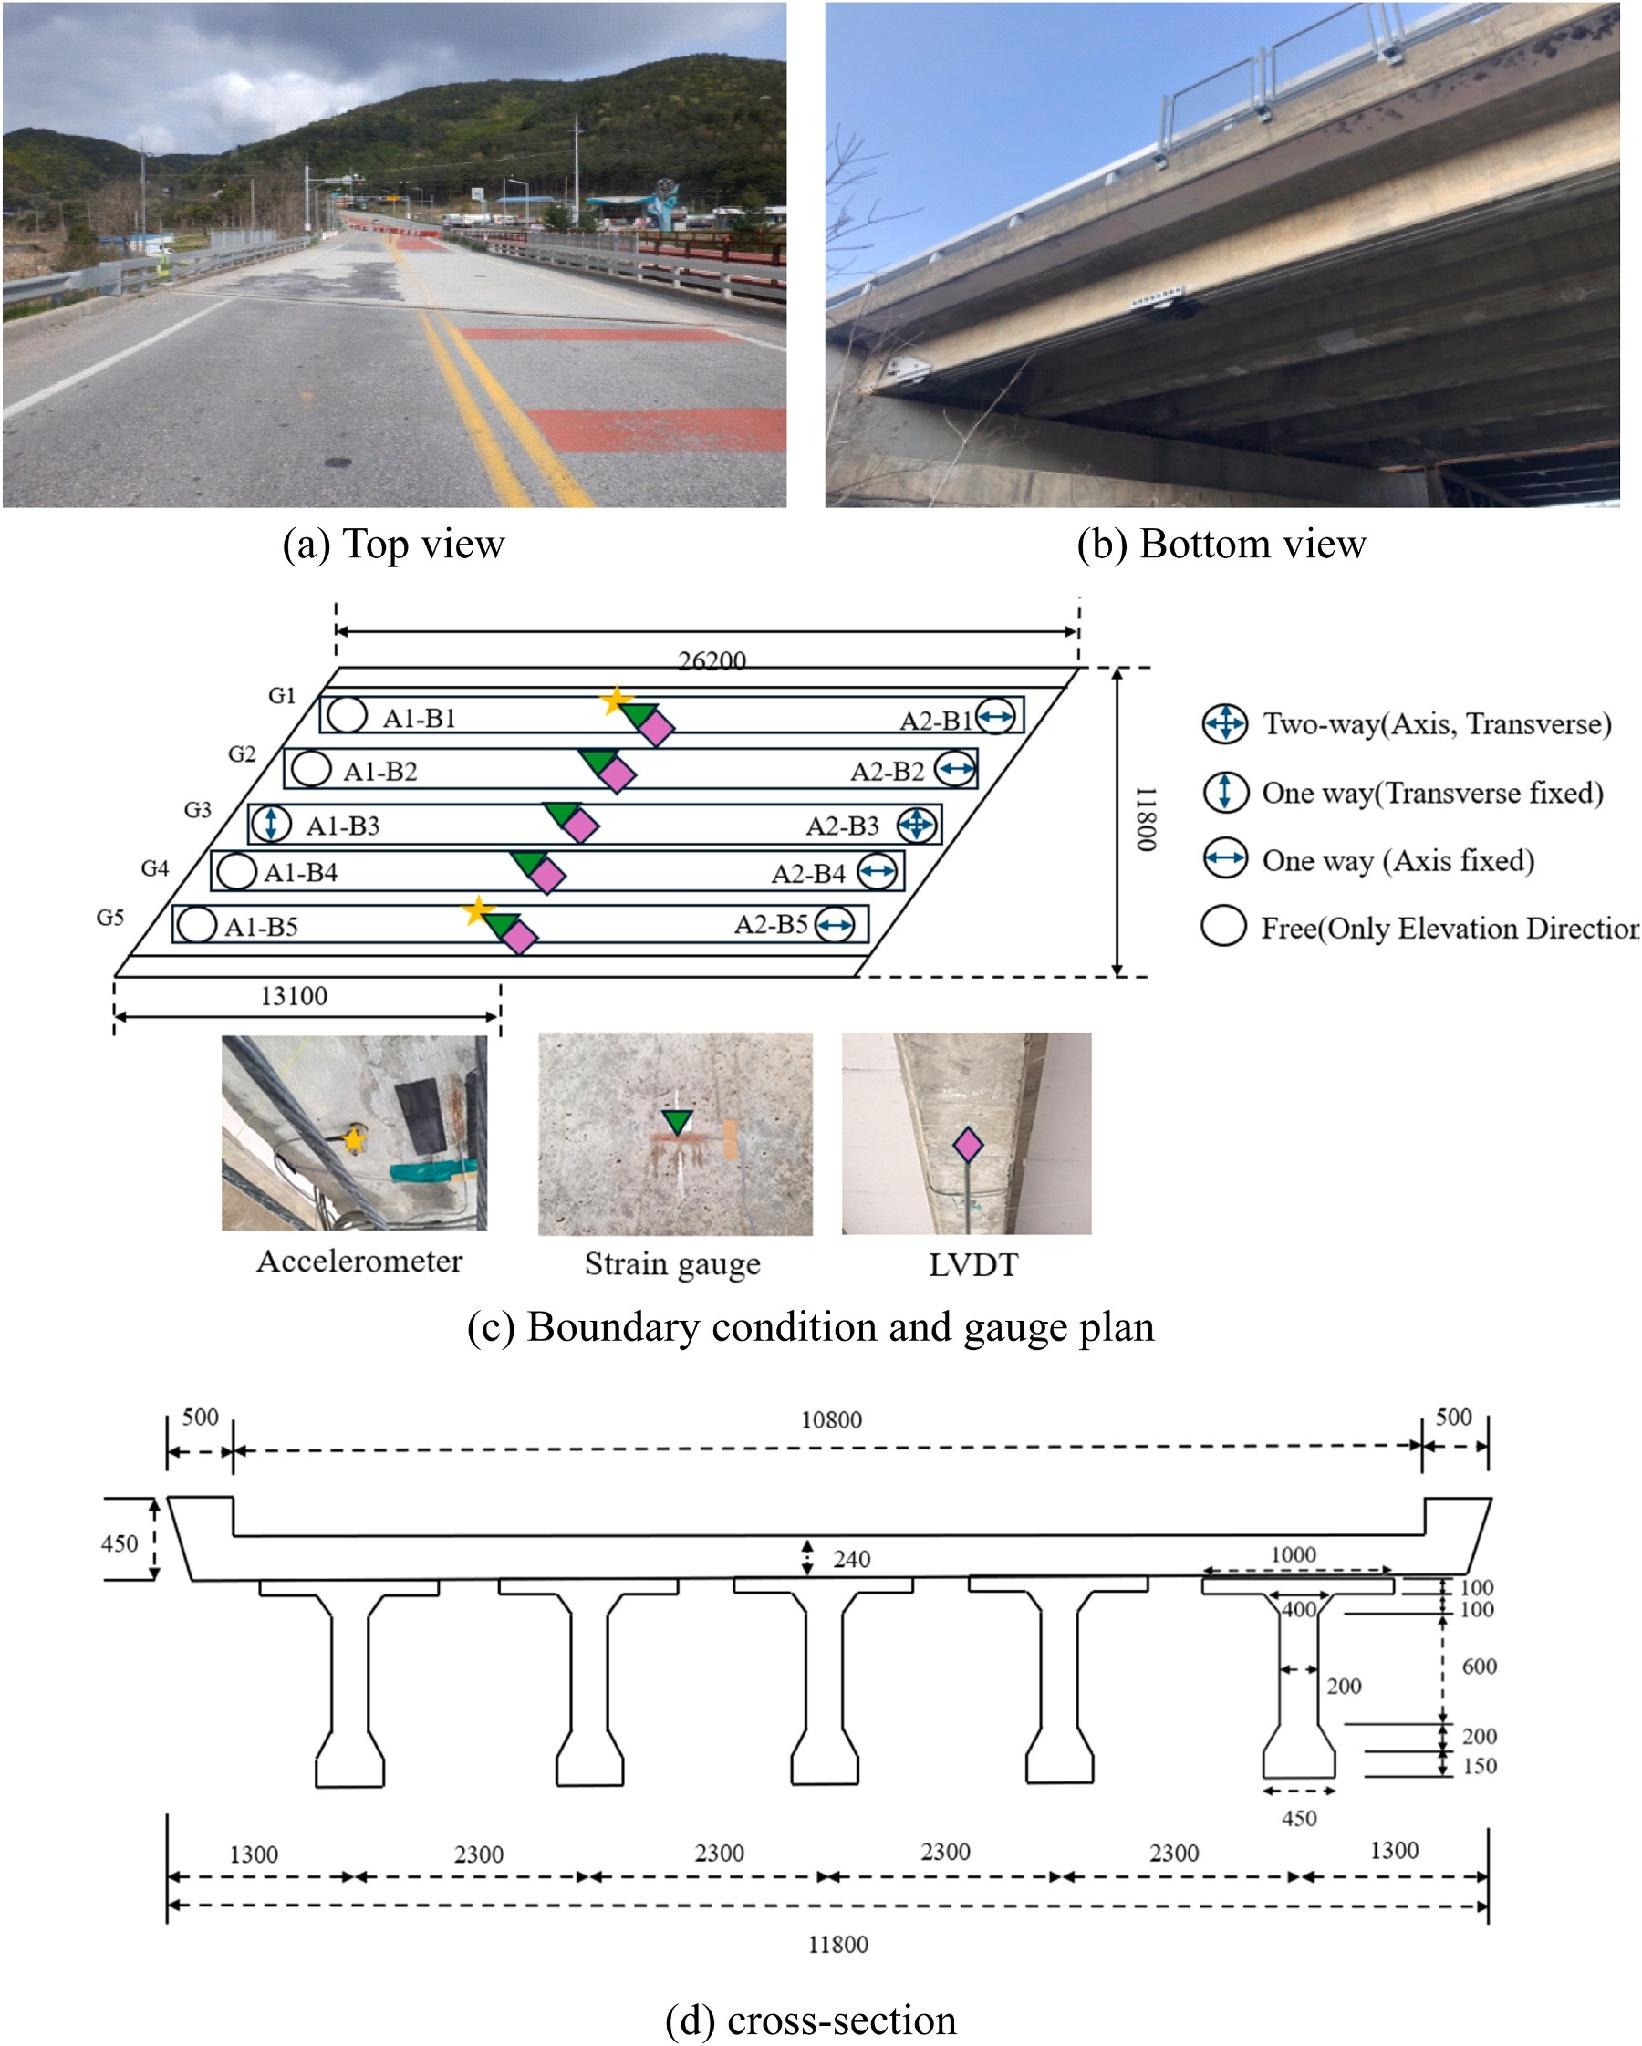
Fig. 3. Description of 45-year-old PSC bridge.
3. Case study on 45-year-old bridge
3.1. Bridge description
The bridge used for the case study, as shown in Fig. 3, was a 45-yearold PSC bridge that was constructed in 1975 and demolished in 2020. The bridge was simply supported bridge with a span length and width of 26.2 m and 11.8 m, respectively. It consisted of five PSC girders and a reinforced concrete slab and was skewed by 63◦. This bridge has been subjected to accumulated damage and undergone reinforcement in various parts through inspections over the years. Its major damage included cracks and breaks in the concrete pavement, cracks in the PSC girders, corrosion of the supports, and efflorescence found in many places. As shown in Fig. 3(b), additional tension was introduced to the two outer girders through external steel wires, and the underside of the deck slab was reinforced with steel-plate reinforcement. It seems that this reinforcement was applied owing to concerns about insufficient load-carrying capacity during operation. Fig. 3(c) and Fig. 3(d) respectively present the boundary conditions of the bridge along with the types and locations of sensors attached during the load test, and the dimensions of the bridge cross-section.
The DTM proposed in this study was established based on the life cycle data obtained from the demolition and assessment of a PSC bridge that had been in service for 45 years. As illustrated in Fig. 4, the process encompassed all phases of the bridge’s life cycle—including demolition decision-making, load testing, visual inspection, deck and girder dismantling, component transportation, concrete coring, tendon cutting, flexural testing, and structural condition assessment. Both quantitative and qualitative data were systematically collected throughout each stage. In particular, the discrepancy identified between the original 1970s design documents and the actual measurements from the dismantled girders was explicitly reflected in the digital twin structure, thereby ensuring the model’s alignment with the real as-built and inservice conditions.
To ensure the reliability of the acquired data, meticulous care was taken throughout the entire process—from demolition to transportation and testing—with measures in place to prevent structural damage. This was supported by the operation of a dedicated research organization established for the empirical study of aging infrastructure [26]. The dismantled girders employed in this study were previously verified to be structurally sound based on experimental data from established research, ensuring their suitability for model validation. Consequently, the data utilized in this study was not based on assumed historical records but derived from empirical evaluations reflecting the actual structural behavior and performance. Through this process, the resulting DTM was constructed as a reality-based, high-fidelity structural model, aiming to ensure its validity as a foundation for future digital twin developments.(Table 1)
3.2. Flexural test of PSC girders
In an earlier study [27], flexural tests were performed on two PSC girders of the bridge, which were dismantled in 2020. One girder was used as a reference member for the experiment, and the other was artificially damaged to evaluate changes in the structural behavior. By comparison, in this study, we intend to construct a DTM using the flexural test data and the results for the reference member. Fig. 3(d) shows the specifications of the PSC member. The cross section was cut after the flexural test to directly obtain the cross-sectional specifications. In addition, the material properties of the members were directly evaluated through concrete coring and tendon tensile tests, and the results are listed in Table 2.
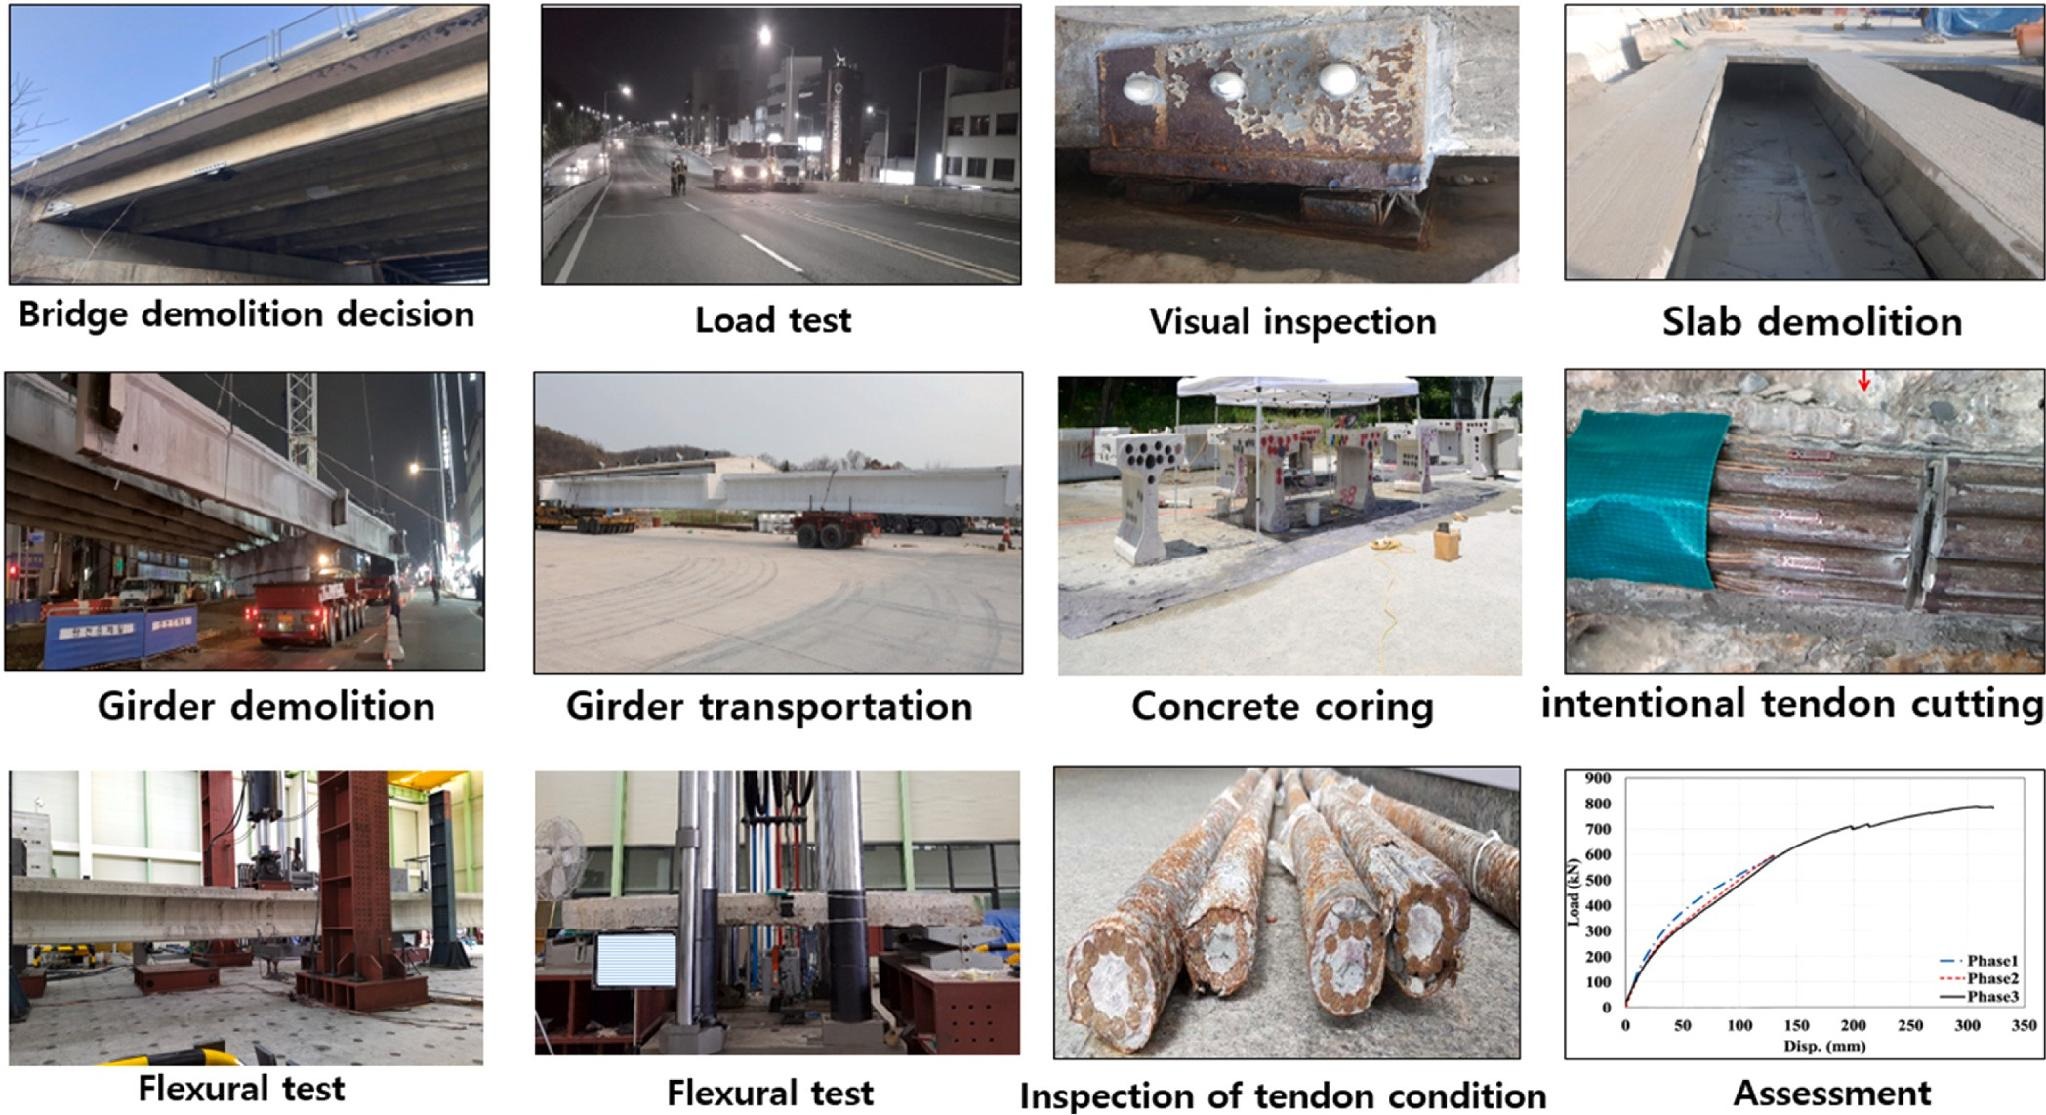
Fig. 4. Procedures for the bridge evaluation from demolition to member assessment.
Table 1
Overview of digital twin-based approaches for structural monitoring and maintenance.
Reference | Target Structure | Role of Digital Twin | Key Contribution |
|---|---|---|---|
Shim et al. [13] | PSC bridge | Maintenance system integrating 3D BIM and inspection data | Established a digital foundation for proactive maintenance |
Yu et al. [14] | Cable-stayed bridge | Hybrid monitoring combining FE and sensor data | Enhanced fatigue damage assessment accuracy |
Ye et al. [15] | Highway bridges (general) | Performance evaluation using analytical and real data | Built a framework for condition-based maintenance |
Jeon et al. [16] | PSC bridge | Information system linking KPIs with digital twin | Implemented prescriptive maintenance strategies |
Mahmoodian et al. [17] | General infrastructure | Predictive maintenance framework with real-time IoT data | Demonstrated predictive capability in real systems |
Roh et al. [18] | PSC-I girder bridge | Baseline Digital Twin Model (BDTM) definition and calibration | Prepared for realtime digital twin implementation |
Table 2
Material properties of concrete and steel wire.
Compressive strength of concrete Girder (MPa) Slab (MPa) | Mechanical properties of steel wire Yield strength Tensile strength Tensile strain (ε) (MPa) (MPa) | |||||
|---|---|---|---|---|---|---|
Design (fcm) Coring test | Minimum Average Standard Deviation Number of samples Statistical distribution | 43 16.94 37.45 8.09 70 Normal [28] | 32 10.9 46.48 12.72 47 Normal [29] | 1277 1290 1364 37.48 14 Normal [29] | 1472 1526 1549 22.40 14 | 0.045 0.038 0.046 0.004 14 Normal [29] |
4. Definition of digital twin models for bridge members based on historical data
4.1. Digital twin configuration system
As shown in Fig. 5, the DTM of a member unit consists of the data system definition, rule-based modeling that reflects the constraints and design conditions for the alignment, a model update process for the KPIs, and analysis model linkage. The KPIs are closely related to the load carrying capacity and rating factor of bridges in service, and are therefore defined as critical factors that directly link the evaluation of individual members to the overall bridge system. For girders, KPIs are defined by the concrete strength, elastic modulus, and residual stress of the prestressing tendons. For slabs, they are defined by the concrete strength and elastic modulus, with slab thickness additionally considered depending on the casting method. In addition to serving as the basis for estimating KPIs, the data are treated as quantitative indicators for evaluating the bridge. Accordingly, the dataset includes not only the variables necessary for KPI estimation, but also invariant information that remains unchanged throughout the bridge’s life cycle.
The data are written in the form of a data template, akin to how the information is presented in Tables 2–3, in which historical data of the 45-year-old bridge, reflecting its life cycle from design to maintenance, are gathered. Based on these data, actual measurements, materials, and flexural test data should be reflected in the DTM. The data template is defined by the cross-sectional properties, tendon profiles for geometry information, and material properties such as concrete compressive and tensile strength, and steel yield and tensile strength for analysis and model updating. Modeling for the geometric model was written using Revit Dynamo, whereas analysis linkage was performed using OpenSeesPy [30]. For the PSC girder member, each cross section and each tendon profile are defined using design information based on the point constraint corresponding to the boundary condition and the alignment constraint corresponding to the upper alignment of the girder, whereas each geometry information is interconnected with the analysis model in OpenSeesPy. Based on the geometry data of the model and the material properties of the data template, the analysis model is defined by reflecting the cross-sectional specifications, boundary conditions, and material model of the fiber section model in OpenSeesPy. In the phase of composing the material part in FEA, we used the Concrete4 model for the concrete material and Steel2 model for the tendon material based on already defined data [28], as shown in Fig. 6. After the manufacturing stage, when information on the observed strain or deflection is received, model updates are performed to fit the observed values based on the constructed system, and corrections are made to the performance factors and performance of the model. Furthermore, the data transfer from BIM to FEA is repeated. Finally, the displacement, strain, and stress data calculated using the linked analysis model are visualized using the BIM geometry model.
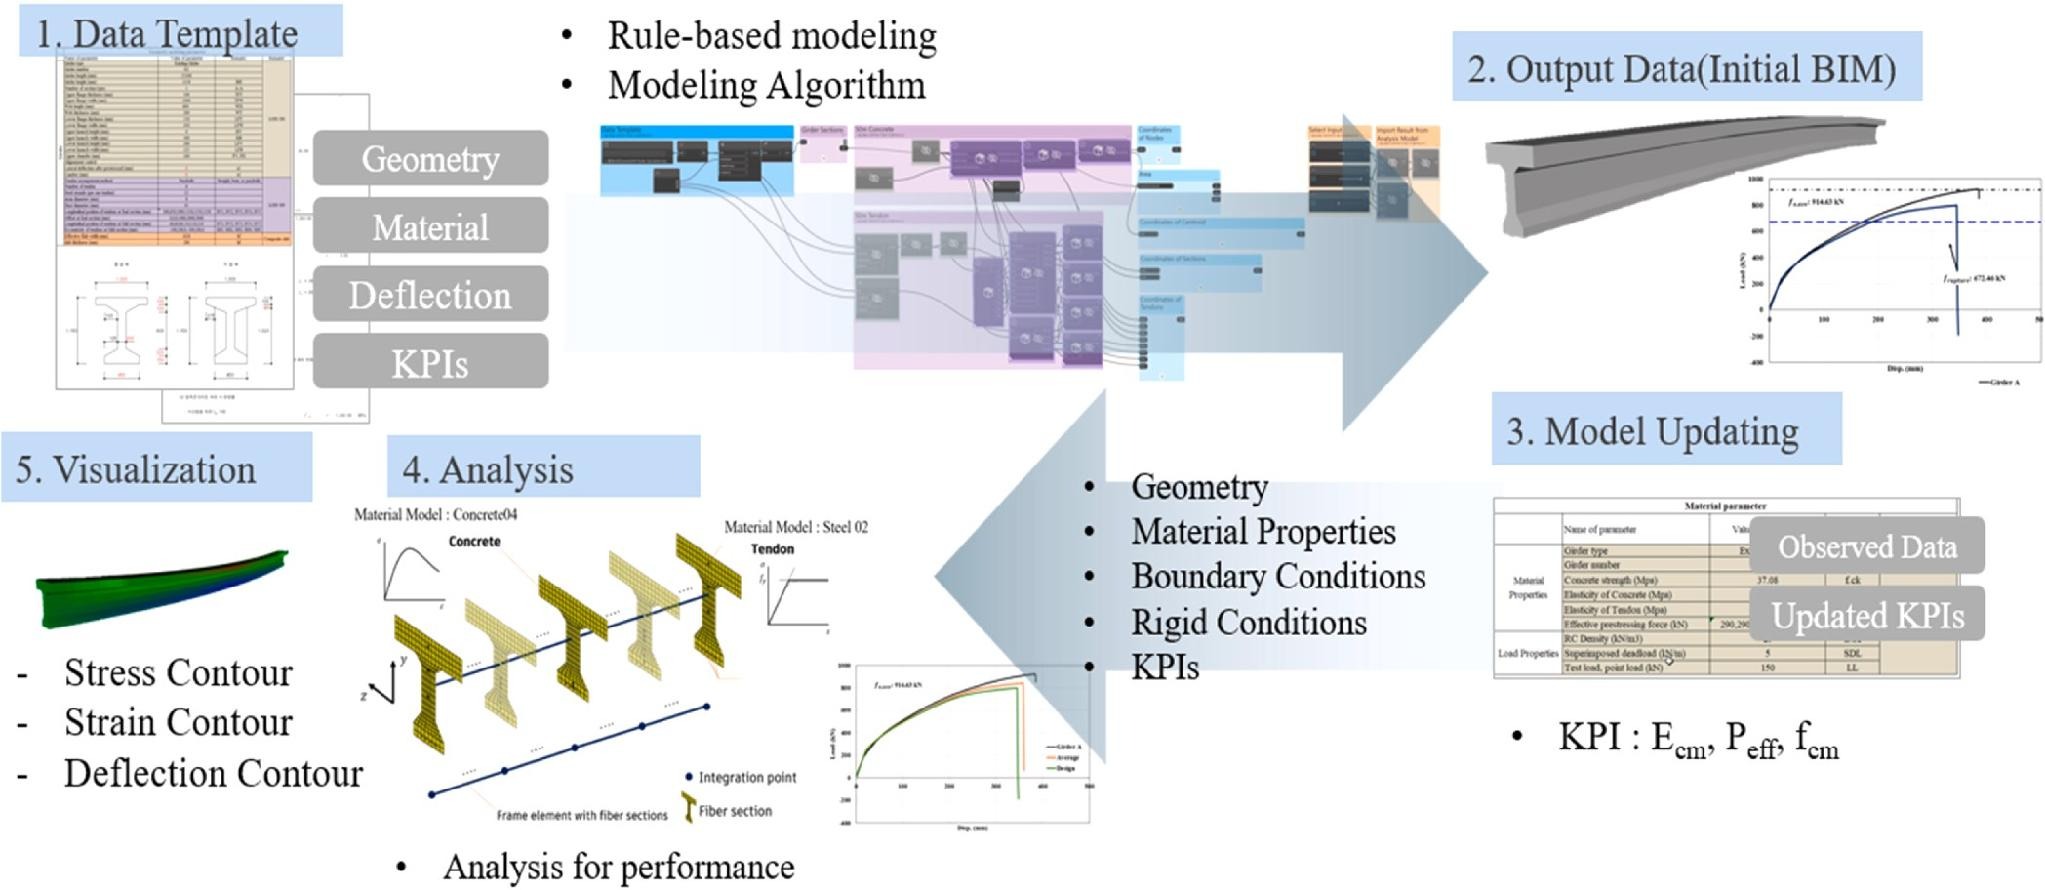
Fig. 5. DTM configuration for PSC-I girder.
4.2. Model updating using genetic algorithm
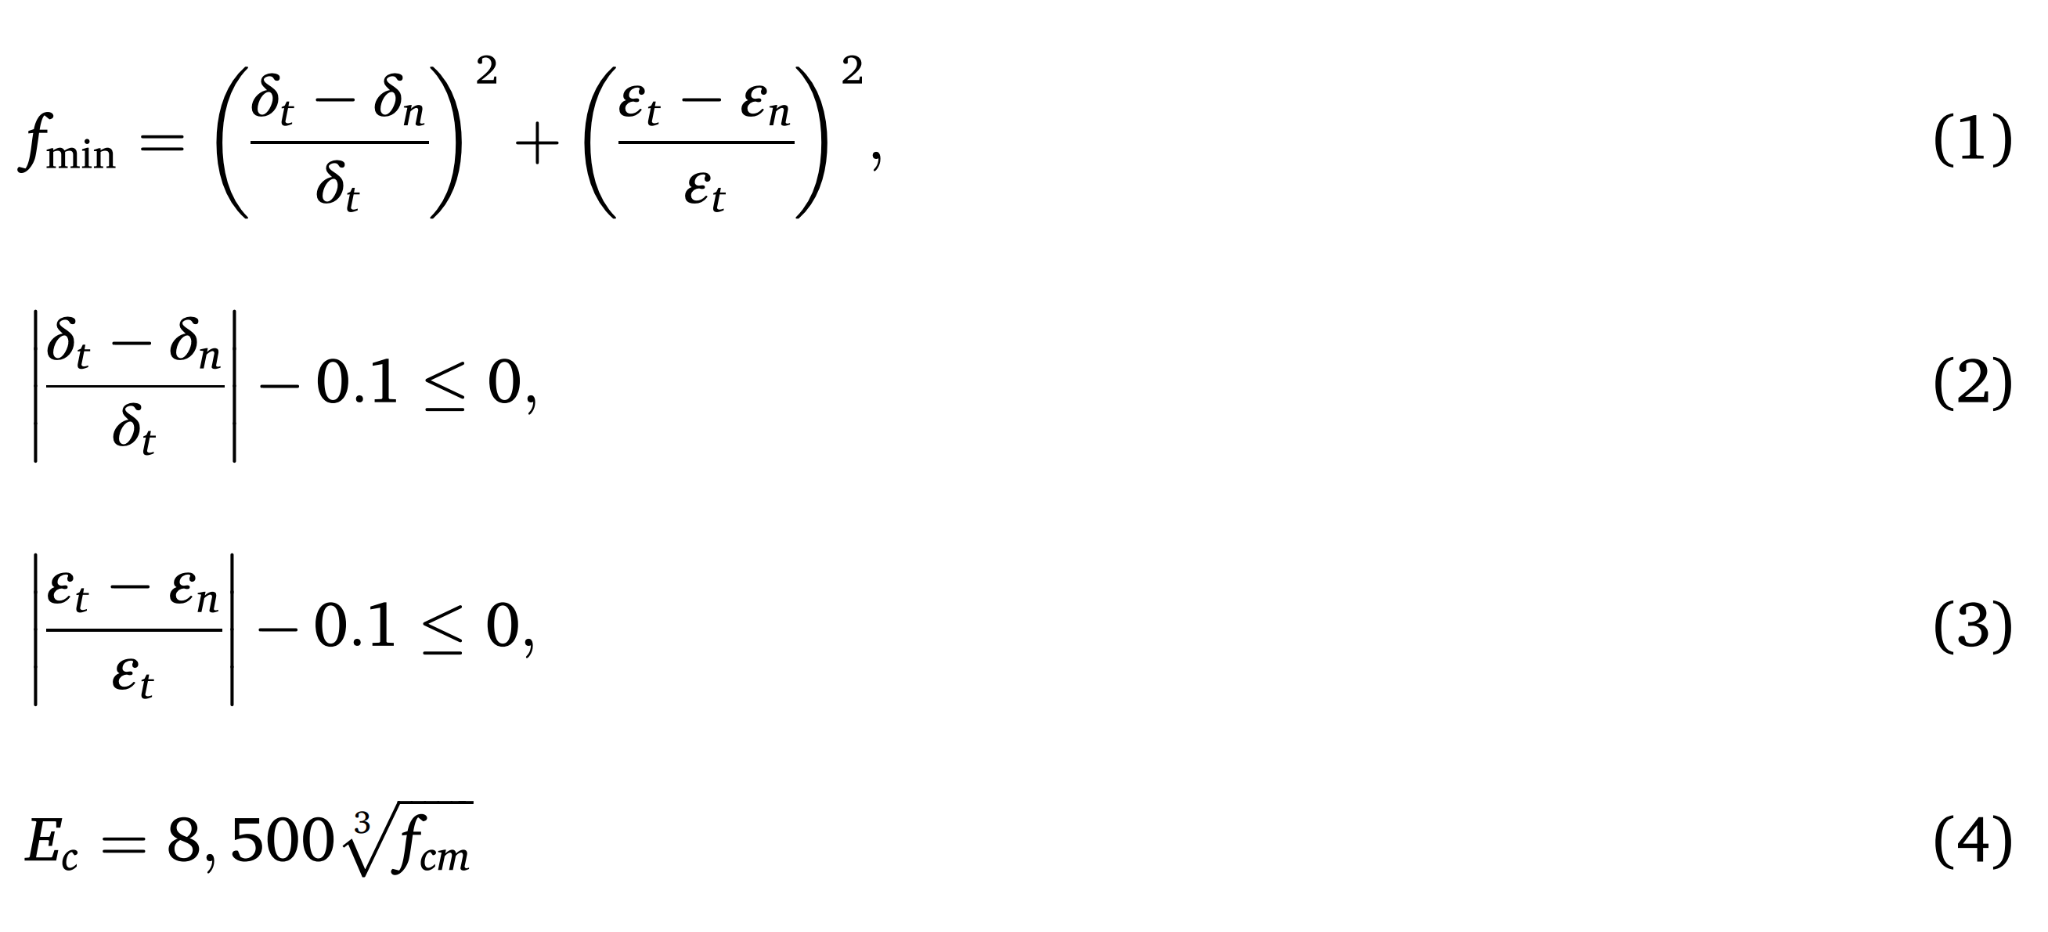
The behaviors of actual structures differ from the theoretical behavior for various reasons, such as material property variability, geometric variability, and defects. However, because the numerical model in DTM must be able to accurately describe actual behaviors, a model-updating process is necessary to match the actual behavioral characteristics. Since an earlier study [29], model-updating techniques have been categorized into two types. The first type provides a probability distribution for each of the target updating parameters; however, these methods often require a relatively large computational cost. By contrast, the second type provides only a singular value, referred to as a deterministic way, but its computational cost is relatively low. In this study, a deterministic method known as a genetic algorithm (GA) was applied. When a numerical model is calibrated using a GA, the objective function is selected based on the difference from the actual behavioral characteristics, and the behavioral characteristics can be considered as either dynamic properties or static properties. Model updating using dynamic properties in GA has already been discussed in past studies [31,32]; however, it is not appropriate as a method for the DTM of PSC girders presented in this paper. This is because the dynamic testing of PSC members during the construction of a PSC bridge is restricted by several factors (management, equipment, cost, etc.) and is therefore not suitable for tracking the changing statuses of PSC girders during transportation and installation. On the other hand, static testing can be used to efficiently track long-term changes, such as load variation during construction, introduction and loss of prestressing force, and deterioration during operation. Therefore, in the GA used in this study, static behavior is utilized in the objective function (fmin), as shown in Eq. (1). Additionally, to avoid local optimization and reduce computation time, a number of constraints, defined in Eqs. (2) and (3), are applied.
Table 3
Data template for a PSC-girder bridge (case study).
Item | Parameter | Unit | Input Value |
|---|---|---|---|
General | Girder number Girder length Girder height | - mm mm | 5 25,200 1150 |
Girder Cross-Section | Upper flange width Upper flange thickness Upper flange width Upper flange height Web height Web width Lower haunch width Lower haunch thickness Lower flange width Lower flange thickness | mm mm mm mm mm mm mm mm mm mm | 1000 100 300 100 600 200 450 200 450 150 |
Tendon | Number of tendons Number of strands in tendon Strand diameter Duct diameter | - - mm mm | 6 12 8 45 |
Tendon Profile | y = 0.0000102(x − 13100)2 + 110 y = 0.0000084(x − 13100)2 + 110 y = 0.0000102(x − 13100)2 + 110 y = 0.0000055(x − 13100)2 + 60 y = 0.0000034(x − 13100)2 + 60 y = 0.0000014(x − 13100)2 + 60 | mm mm mm mm mm mm | [3000, 22200] [2000, 23200] [1000, 24200] [0, 25200] [0, 25200] [0, 25200] |
Slab | Slab width Thickness | mm mm | 10,800 240 |
Barrier | Height width | mm mm | 190 500 |
Diaphragm | Height Thickness | mm mm | 1000 200 |
Material properties | Girder concrete strength (fck) Slab, Barrier, Diaphragm concrete strength Strand yield strength Strand ultimate strength Strand modulus of elasticity Rebar yield strength Rebar modulus of elasticity | MPa MPa MPa MPa MPa MPa MPa | 35 24 1277 1472 200,000 300 200,000 |
Model updating was performed by applying the GA to the PSC-girder bending specimen from an earlier study [27]. Fig. 7 presents the locations and details of the strain gauges and LVDTs attached during the girder testing. Strain gauges were installed at the 1/4, 1/2, and 3/4 spans along the webs, top, and bottom surfaces of the girder. On the top and bottom surfaces, three gauges were placed at the 1/4 and 3/4 spans, while six gauges were placed at the midspan (1/2 point). On the webs, five gauges were attached at each span location. For displacement measurements, LVDTs were installed at the same positions as the strain gauges.
In Eq. (1), δt and εt are the deflection and concrete strain at the center of the girder obtained during the flexural test, respectively, and data before crack occurrence are used. The updating variables are the concrete strength, fc; elastic modulus of the prestressing tendon and rebar, Es; and effective prestressing force, Pe, as listed in Table 4. In the earlier study [27], the material properties, as shown in Table 2, were obtained through material tests, but all the initial values used were from the design calculation to verify the performance of the GA. The elastic modulus of concrete, Ec, is defined as in Eq. (4), in accordance with KDS 14 20 10–2021: Concrete structural analysis and design principles [33]. Meanwhile, fcm denotes the mean compressive strength of concrete and is a concept proposed to reflect the actual strength characteristics of concrete at the design stage, when there is no information on the material. However, because this study used the actual material-strength-test results, fcm and fc were considered to be the same. After the model updates, the updated variables were estimated to be within 1 % of the material-test results for both fc and Pe. Furthermore, Es was estimated to be within the range of the experimental results.
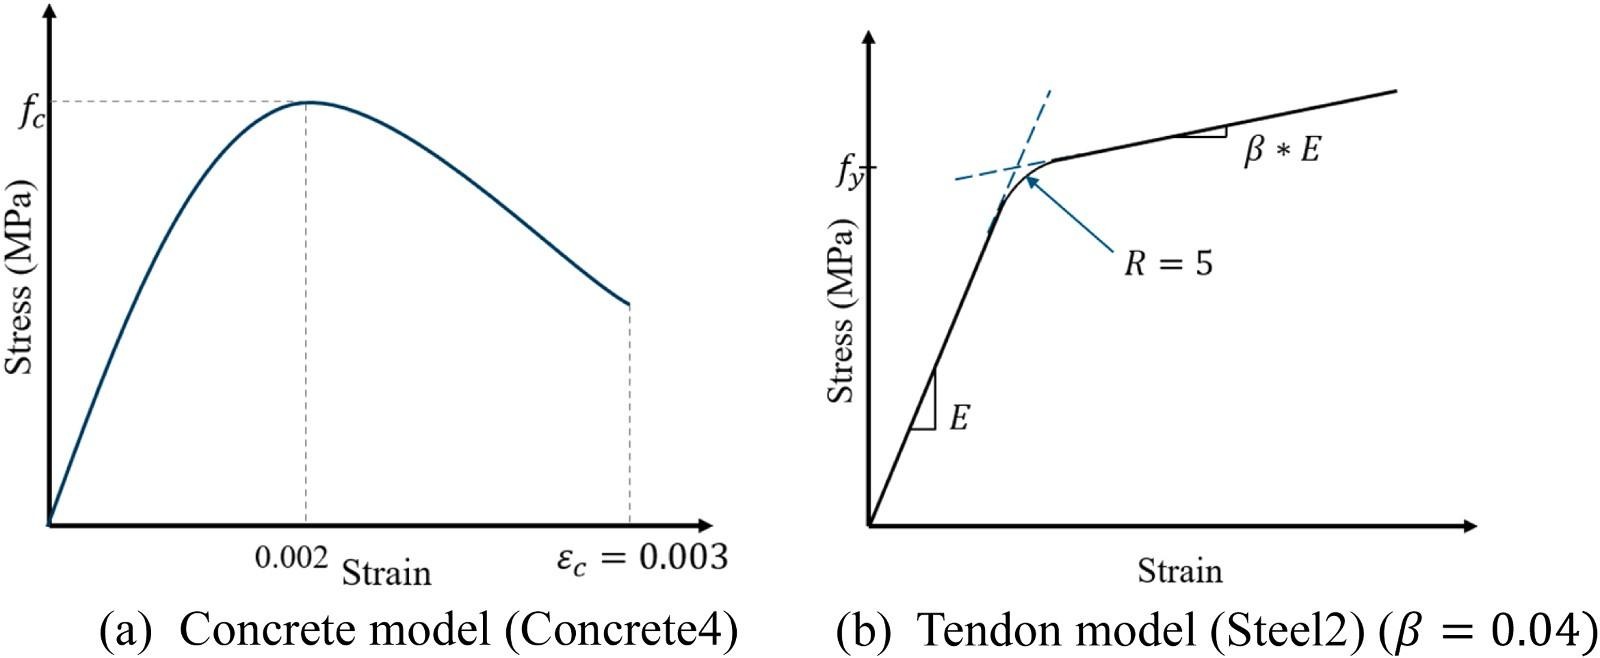
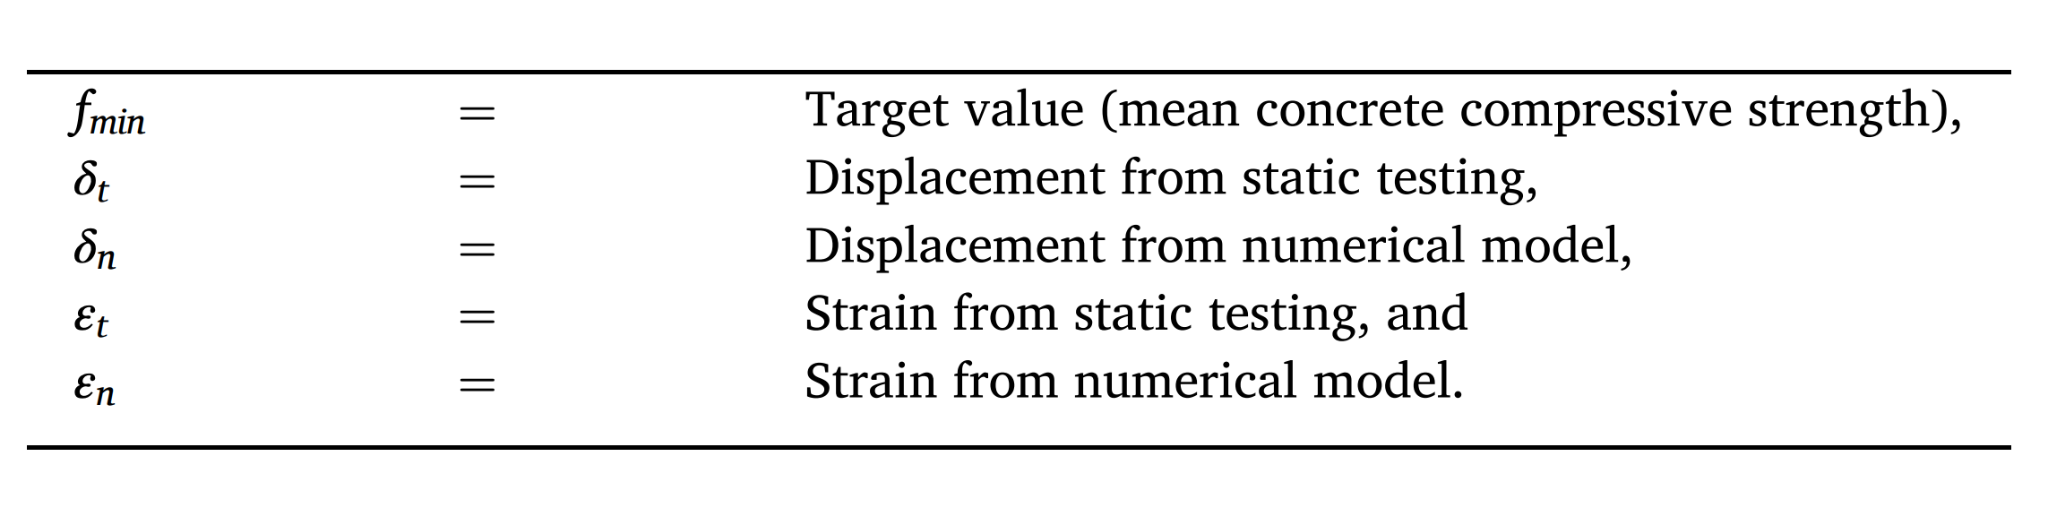
Fig. 6. OpenSeesPy material model for FEA.
Table 4
Initial, test, and updated values of updating variables for PSC-girder DTM
Updating variable | Description | Initial value (MPa) | Test value (MPa) | Updated Value (MPa) |
|---|---|---|---|---|
fc | Concrete compressive strength | 35 | 37.45 | 37.37 |
Es | Elastic modulus of prestressing tendon and rebar | 210,000 | 195,000 ~ 200,000 | 195,382 |
Pe | Effective prestressing force | 770 | 540 | 536 |
4.3. Baseline DTM model for PSC girders
The model, including the performance of the updated member, which can reveal its crack strength and flexural strength, was defined as the baseline DTM model. This model is also the reference model to be
used afterward as built. First, to evaluate the performance of the girder based on the design data, the results derived from the analysis based on the design data and the results of the experiment were compared, as shown in Fig. 8(a). First, in the case of the crack load, the load value from the analysis based on the design data was calculated to be higher than the actual experimental value. This is because the residual prestressing stress, which reflects the long-term loss, calculated during the design stage was higher than the actual measured stress, which led to a high calculated value for the crack strength. In the case of the maximum applied load, the value from the design-data-based analysis model was confirmed to be low. The design compressive strength of the concrete was evaluated to be lower than the actual strength obtained from coring of the member, and accordingly, the applied load corresponding to concrete compressive failure was also assessed to be lower in the design member than in the actual girder.
Subsequently, the actual values for the collected materials, listed in Table 4, were used in the DTM analysis model and evaluated. As an example of an application of the constructed DTM, it was used to probabilistically predict the cracking and flexural loads of the target PSC girder, and the results were compared with an actual test result. The uncertainty of the material data was considered, and the data points were assumed to follow a normal distribution (in this study, because of the lack of sufficient experimental data, the material properties with uncertainty were assumed to follow independent normal distributions). In the previous update, the compressive strength of the concrete was provided as a single value; however, because it was updated based on the stiffness standard, the data were sampled by reflecting the average value and standard deviation value of the actual cored compressive strength. In addition, to reflect the uncertainty in the tensile strength of the concrete, a tensile-strength calculation formula based on the compressive strength equation, defined by Eqs. (5) and (6), was used to configure a normal distribution. The compressive strength of the slab concrete was defined as following a normal distribution using the same method. Similarly, the data on the yield strength of the tendons were defined as following a normal distribution based on the measured value. Samples were extracted from the four sets of data defined as normal distributions, and MC simulations were performed to evaluate the flexural strength and cracking strength of the twin model by randomly combining the data.
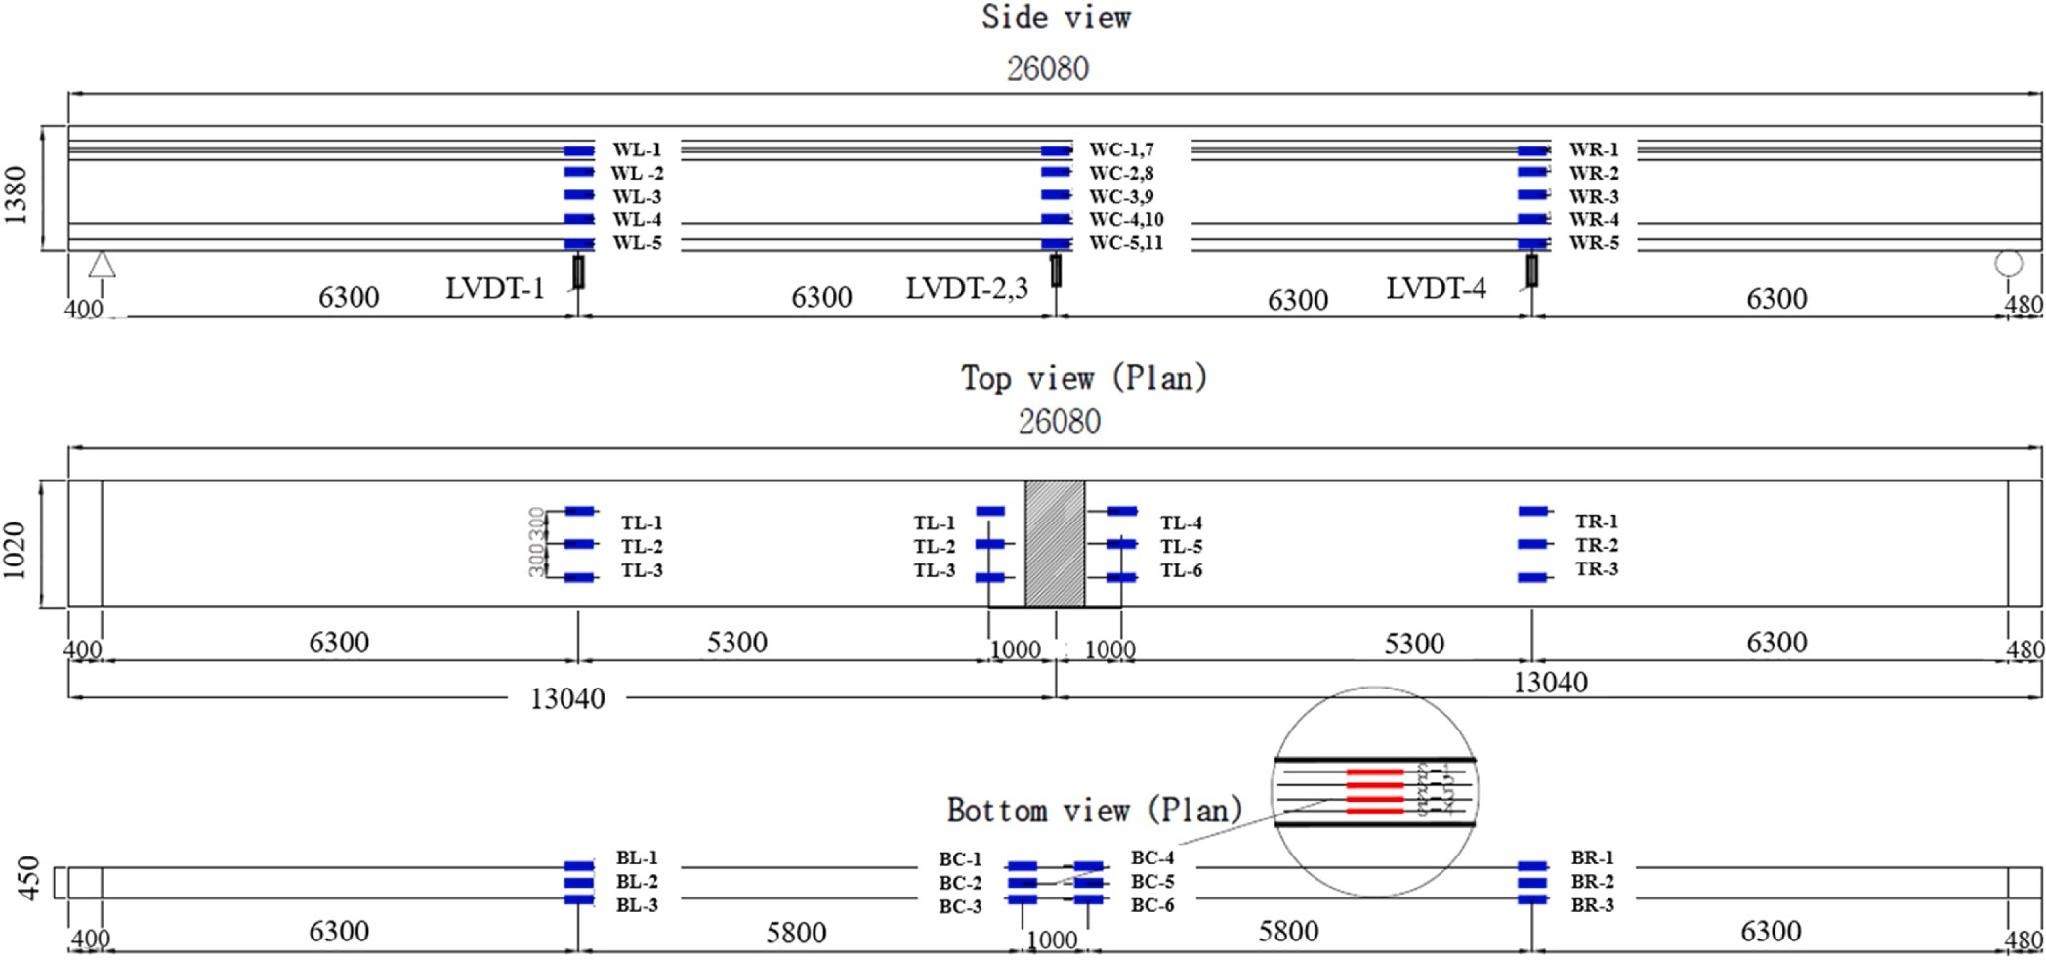
Fig. 7. Types and locations of sensors attached to girders.
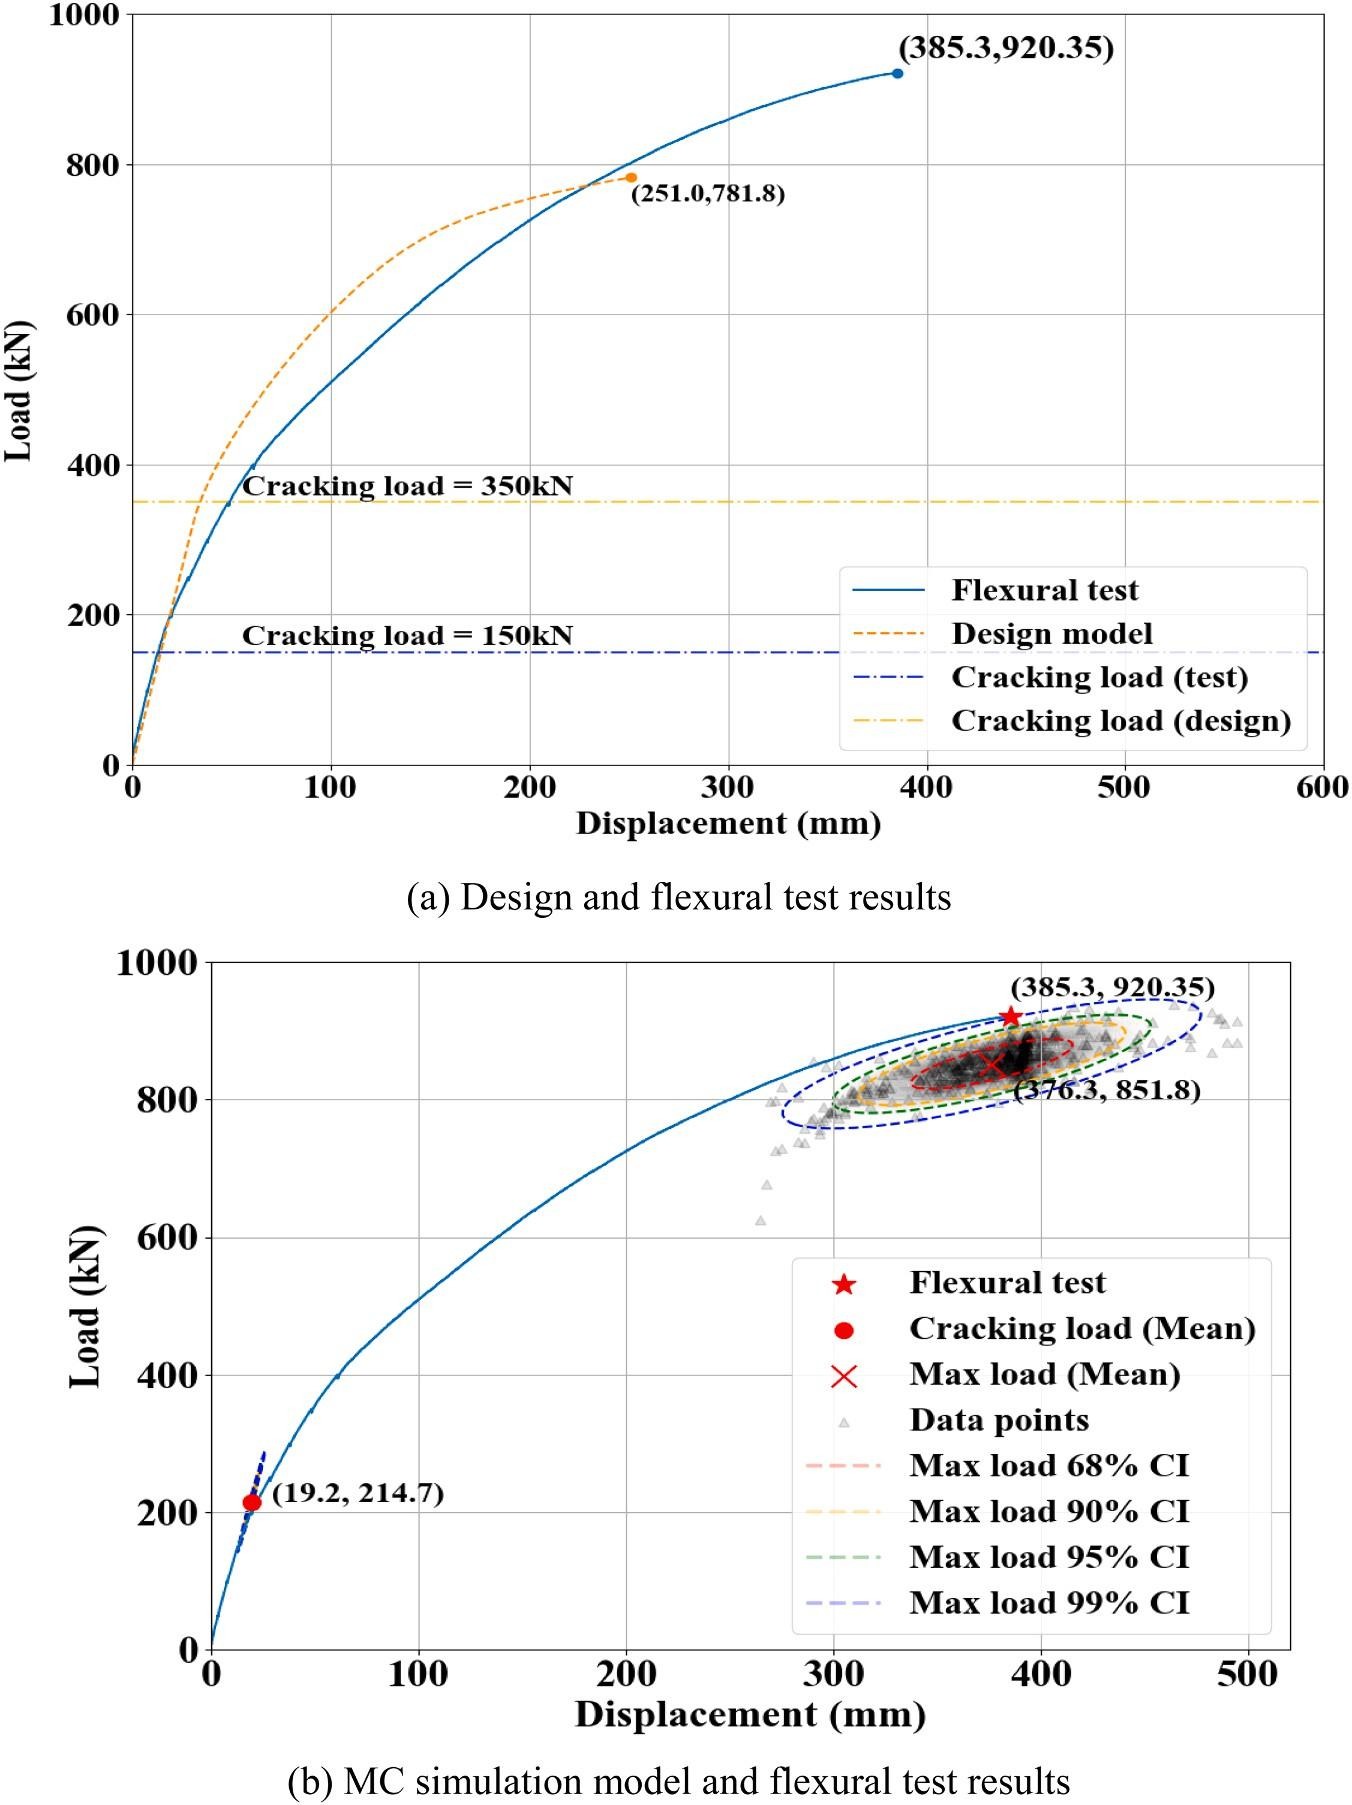
Fig. 8. Load-displacement curve of design, flexural test, MC simulation.

Fig. 8(b) shows the reliability model for the cracking load and maximum applied load of the girder considering the material uncertainty. Each load value was assumed to follow a normal distribution based on the reliability of the data; more specifically, the load values were expressed as a two-dimensional normal distribution that simultaneously reflected the strength and displacement. In the case of the cracking strength, because the elastic modulus and prestressing stress of the concrete are fixed values, the tensile strength of the concrete reflected mainly the reliability of the data. In other words, the distribution of the cracking load appeared to be one-dimensional linear based on the tensile strength; accordingly, a one-dimensional normal distribution is shown in Fig. 9(a). Meanwhile, the distribution of the maximum load is shown in Fig. 9(b), and it was confirmed that the cracking load and maximum load values were within 99 % reliability based on an evaluation focused on the reliability.
4.4. What-if simulation for corroded tendons embedded in a girder based on baseline DTM
It can be assumed that fatal damage to a girder in service is a case of brittle fracture due to corrosion of the internal tendons. This type of corrosion is not only difficult to visually determine in practice but is also difficult to determine from the behavior of the system. When a flexural crack is determined to have occurred based on visual observations, a what-if simulation can be conducted, assuming that there was a corroded steel wire in the girder. The sensitivity of the corroded steel wire to the girder is determined by the area of the corroded steel wire and the location of the corrosion. Corrosion of the tendons located near the end, as seen in the specimen with corrosion at the 1/4 point, exhibited only a minimal effect on the strength of the girder—showing reductions of 1.77 % in strength and 2.77 % in displacement compared to the non-corroded member. This suggests that tendon corrosion at the ends has limited impact on girder performance due to sufficient bonding with surrounding grout, whereas corrosion at the midspan is expected to have a more direct influence on the girder’s strength [34]. The tensile strength of the tendons also demonstrated a trend of decreasing by approximately 10 % for corrosions with cross-sectional areas of 20 % or more. In the case of the ultimate strain, a significant decrease has been observed depending on the cross-sectional area of the corroded steel wire, and accordingly, Jeon et al. [27] proposed a material model for corroded steel wires based on reliability. For the tensile strength of a steel wire with a 95 % confidence level, Eq. (7) was proposed, whereas for the ultimate strain, Eq. (8) was defined as its calculation formula, based on a corrosion cross-sectional area of 5 %. For the ultimate strain of a steel wire with a corrosion cross-sectional area of 5 % or more, a confidence level of 95 % was applied, and the value was proposed to be 0.009.
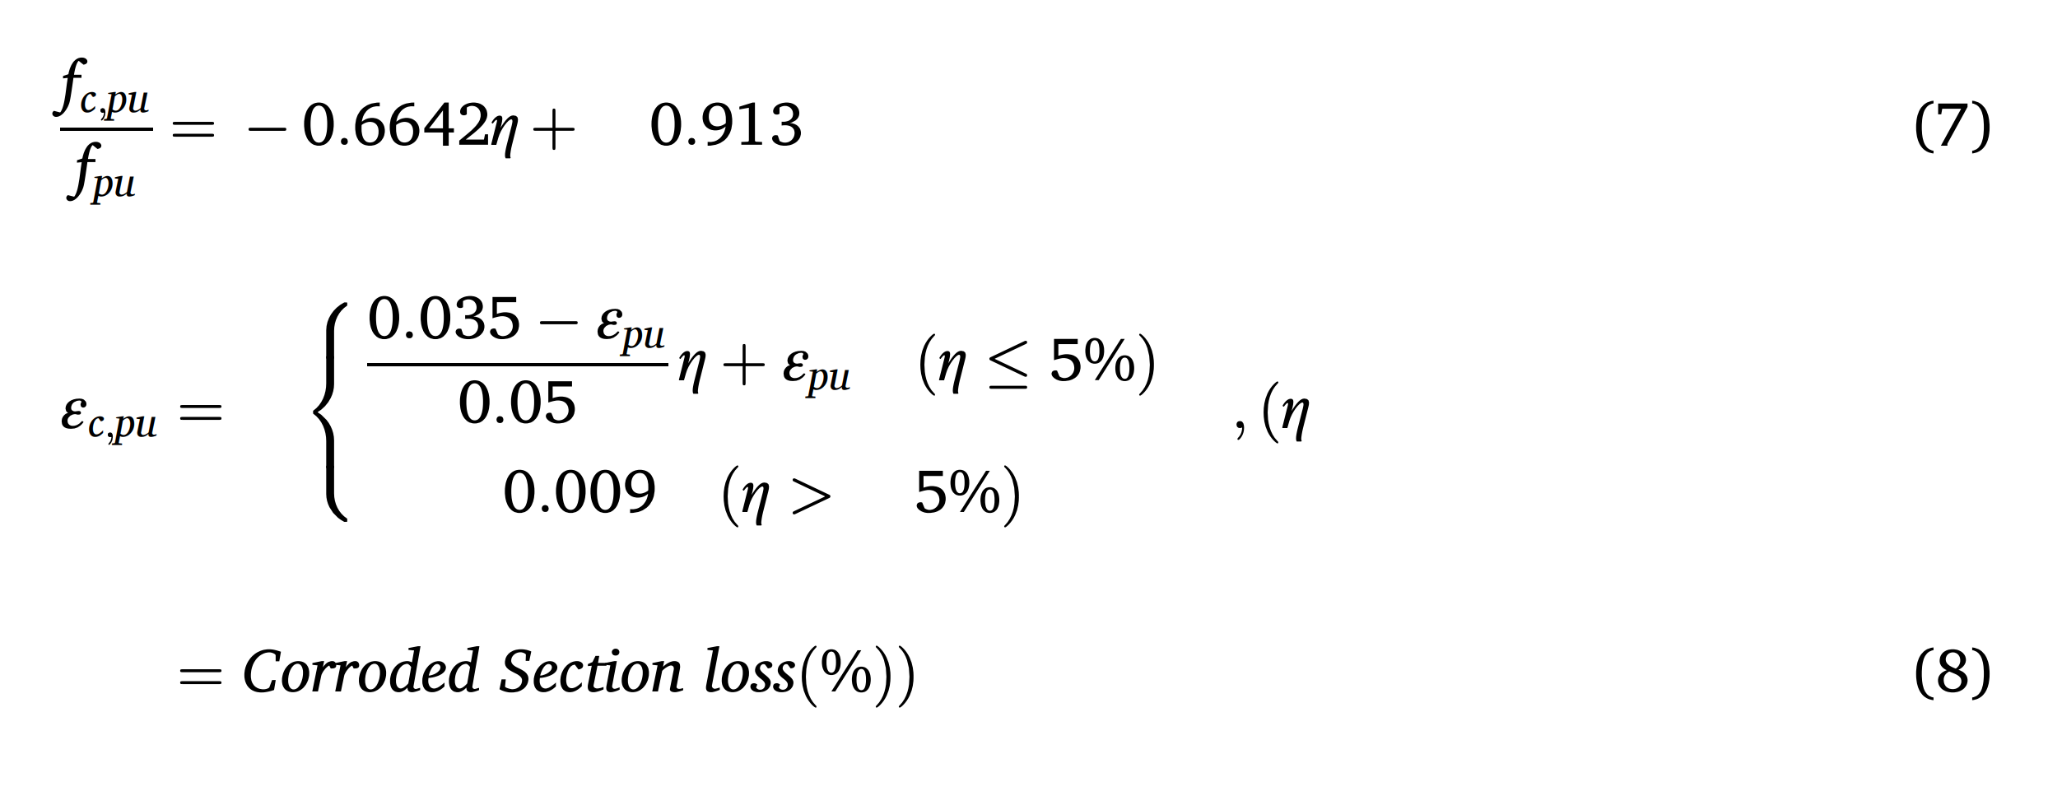
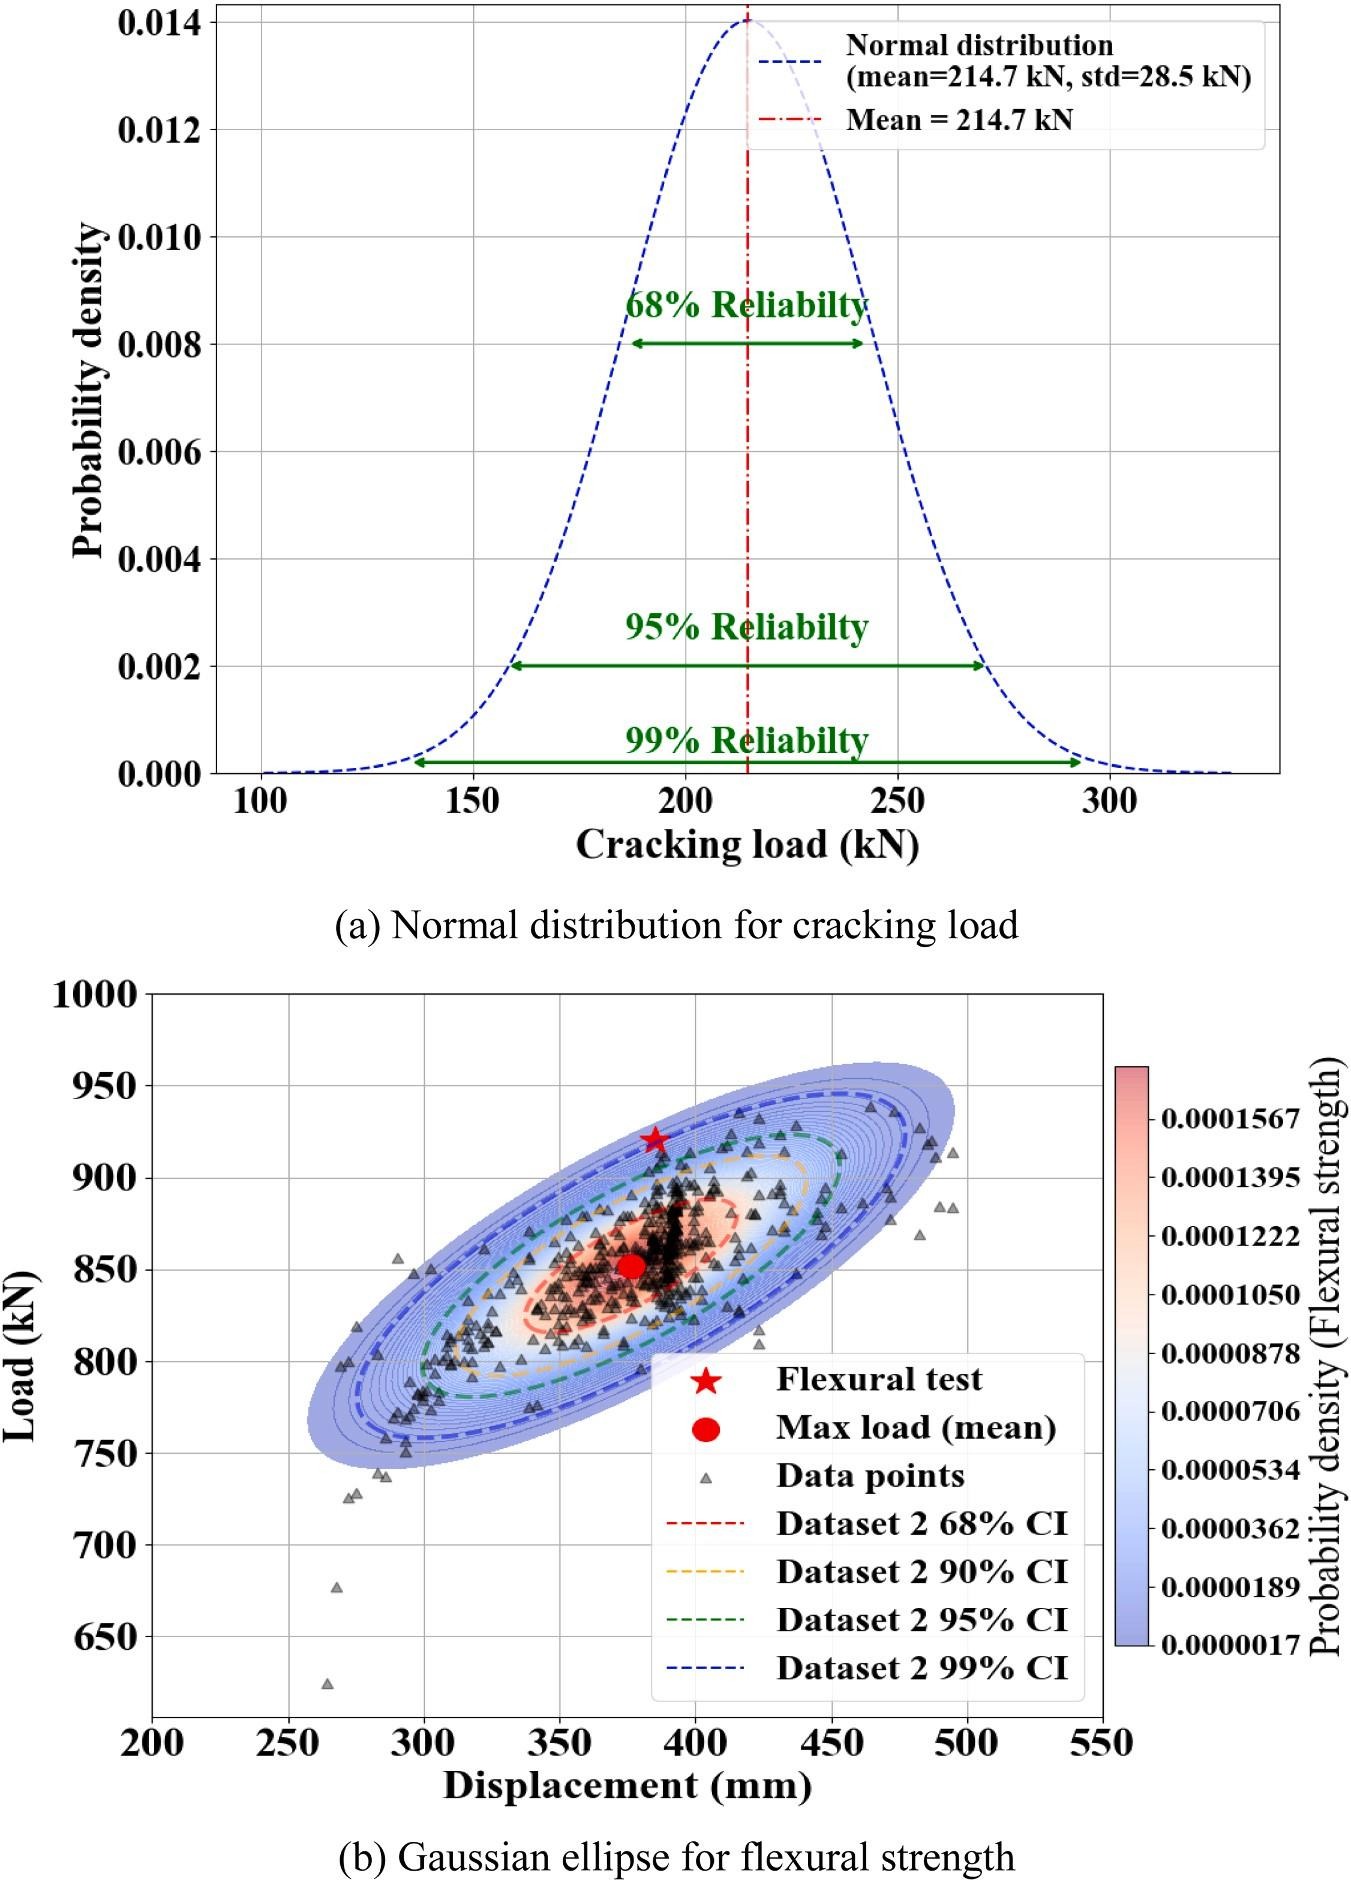
Fig. 9. Data distribution of cracking and flexural load.
In the maintenance phase, to reflect the corrosion simulation in the girder baseline DTM, the area and strain of the corroded steel wires were configured as additional variables in the existing girder twin model. Two regression models that use the experimental data to perform predictions on a corroded steel wire [35] were created, as shown in Fig. 10, and the lower limit boundary was set to 0.009 based on the reliability-based ultimate strain. The regression model of the 4th-order polynomial produced an R2 of 0.635 and a mean square error (MSE) of 0.0001, whereas the exponential function produced an R2 of 0.5574 and an MSE of 0.0002. It was therefore confirmed that between the two models, the 4th-order polynomial model provided better predictions, and thus, the data sampling was performed using the polynomial regression function. An analysis simulation was set up for the case in which the steel wire was 40 % corroded, and the results were compared with the experimental values. When the strain of the girder is equal to the sample value during the analysis, the value of the applied load is defined as the strength of the girder.
To probabilistically evaluate a twin model for the what-if simulation of tendon corrosion while the structure is already in service, in addition to the four variables sampled from the baseline model before service, samples were extracted with the assumption that the ultimate strain value and the tensile strength of the tendon were normally distributed data, and a MC simulation was performed on a total of six variables. Fig. 11 shows a comparison between the experimental results and MC simulation results.
The values derived from the analysis exceeded the load values at which the steel wire broke during the actual experiment. This is because the data on the ultimate strain of the steel wire for a corrosion area of 40% were relatively insufficient. Therefore, the distribution of the strain was high, and the maximum load value was analyzed to be high.
Nevertheless, the distribution was confirmed to be similar to the experimental value when the sample value of the ultimate strain during the simulation was 0.009. If more data on the ultimate strain with respect to the corrosion area are obtained, the Gaussian distribution of the two-dimensional elliptical distribution is expected to be oriented downward to the left.
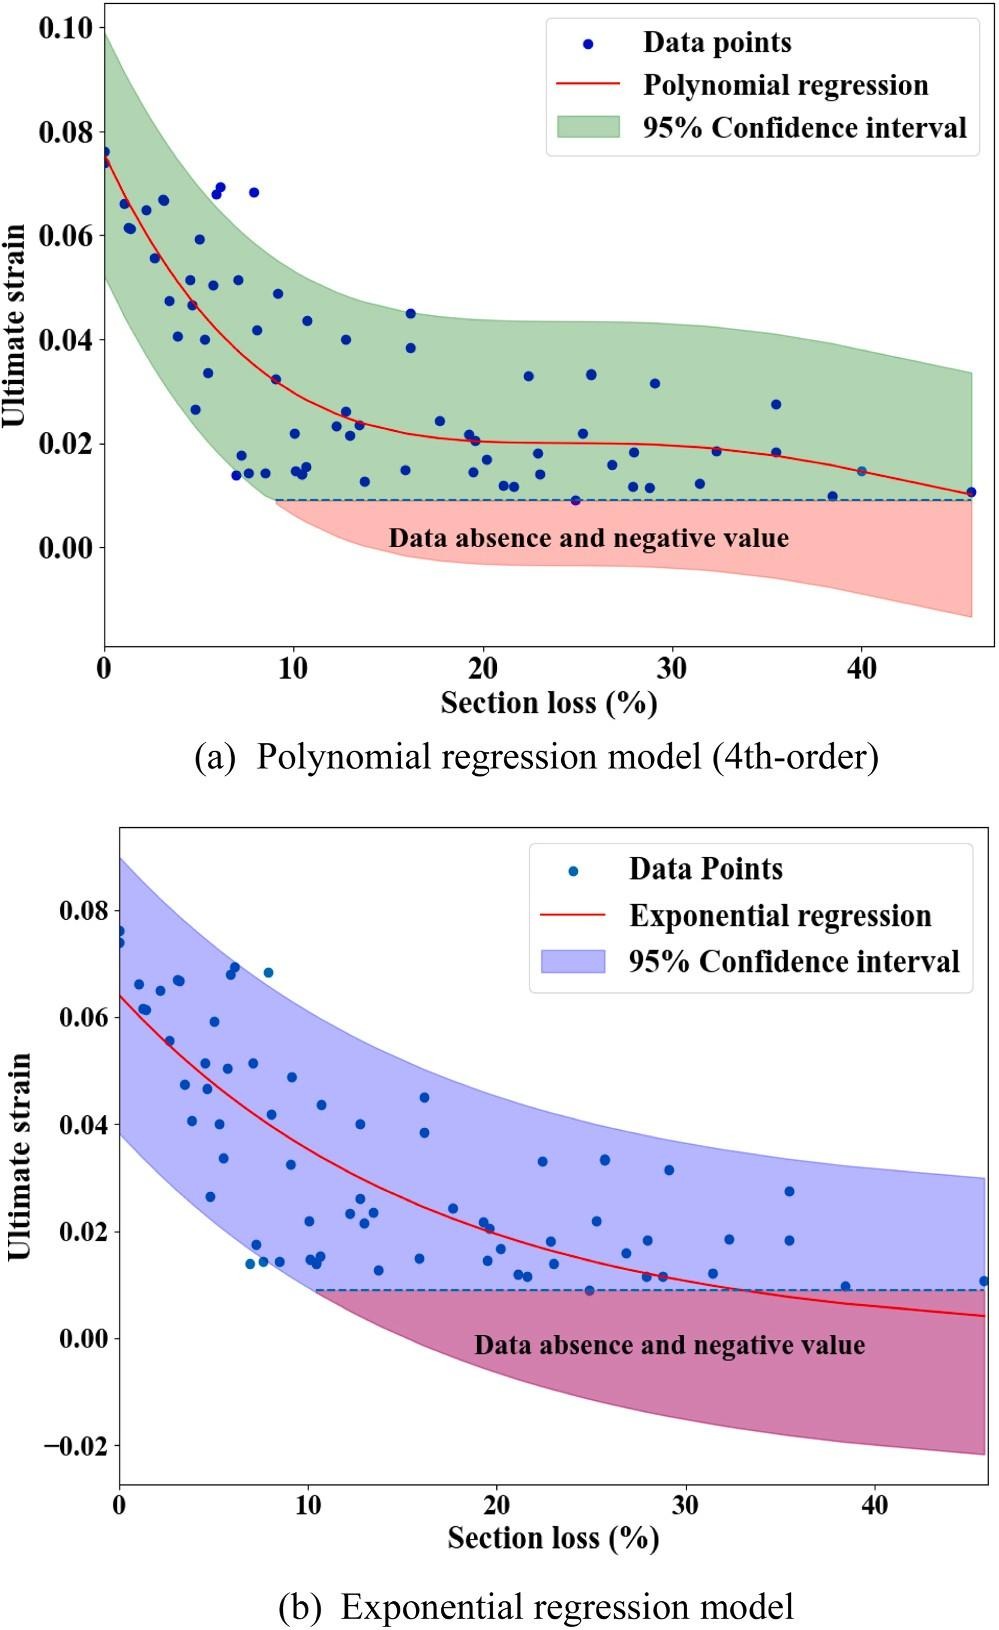
Fig. 10. Regression models for the corroded tendon based on tensile test data
5. Digital twin of PSC bridge
5.1. Model updating for bridge system
The twin model of a bridge unit additionally considers information on the rigid conditions and boundary conditions between members, and the models of multiple member units. The KPI information of the DTM model of the previously defined member unit is used as input to configure the DTM for the system. For the bridge in question, the slab is placed on five girders with a diaphragm on the substructure and at the ends, and a barrier is positioned at each end of the bridge width. Each model has the material properties presented in Table 2 and transfers data from the standard data and BIM model to the analysis model type, as shown in Fig. 12. Based on the shape information of the bridge unit, such as the skew and girder spacing, the analysis model of the girder, barrier, and diaphragm is configured as a beam model, that of the slab is created as a shell model, and that of the support is created as a spring model to model the elastic support used in the bridge. The girder and diaphragm, girder and slab, girder and support, and slab and protective wall are constrained using rigid-body conditions.
To match the design data of the bridge with the actual behavior of the bridge as measured via the load test, model updating was performed using the analysis model. The load-test data for the bridge utilized the deflection data (G1–G5) of each girder from the results of static load tests performed before the bridge was demolished [14]. During the updates, the complexity and amount of calculation increase depending on the number and range of specific variables for optimization, making it difficult to find the global solution of the system. Therefore, the deterministic optimization method was selected and applied with an emphasis on the computational and convergence speeds rather than on global optimization, and the updating was performed using particle swarm optimization (PSO) [36]. When the updating algorithm was implemented, the Python module Pyswarm [37] was linked to the analysis model, and the core hyperparameters, i.e., inertia weight (a coefficient that indicates the tendency to maintain the current speed), cognitive coefficient (a coefficient that controls the tendency of each particle to move to its own optimal position), and social coefficient (a coefficient that controls the tendency of each particle to move to the optimal position of the entire cluster), were each set to 0.5.
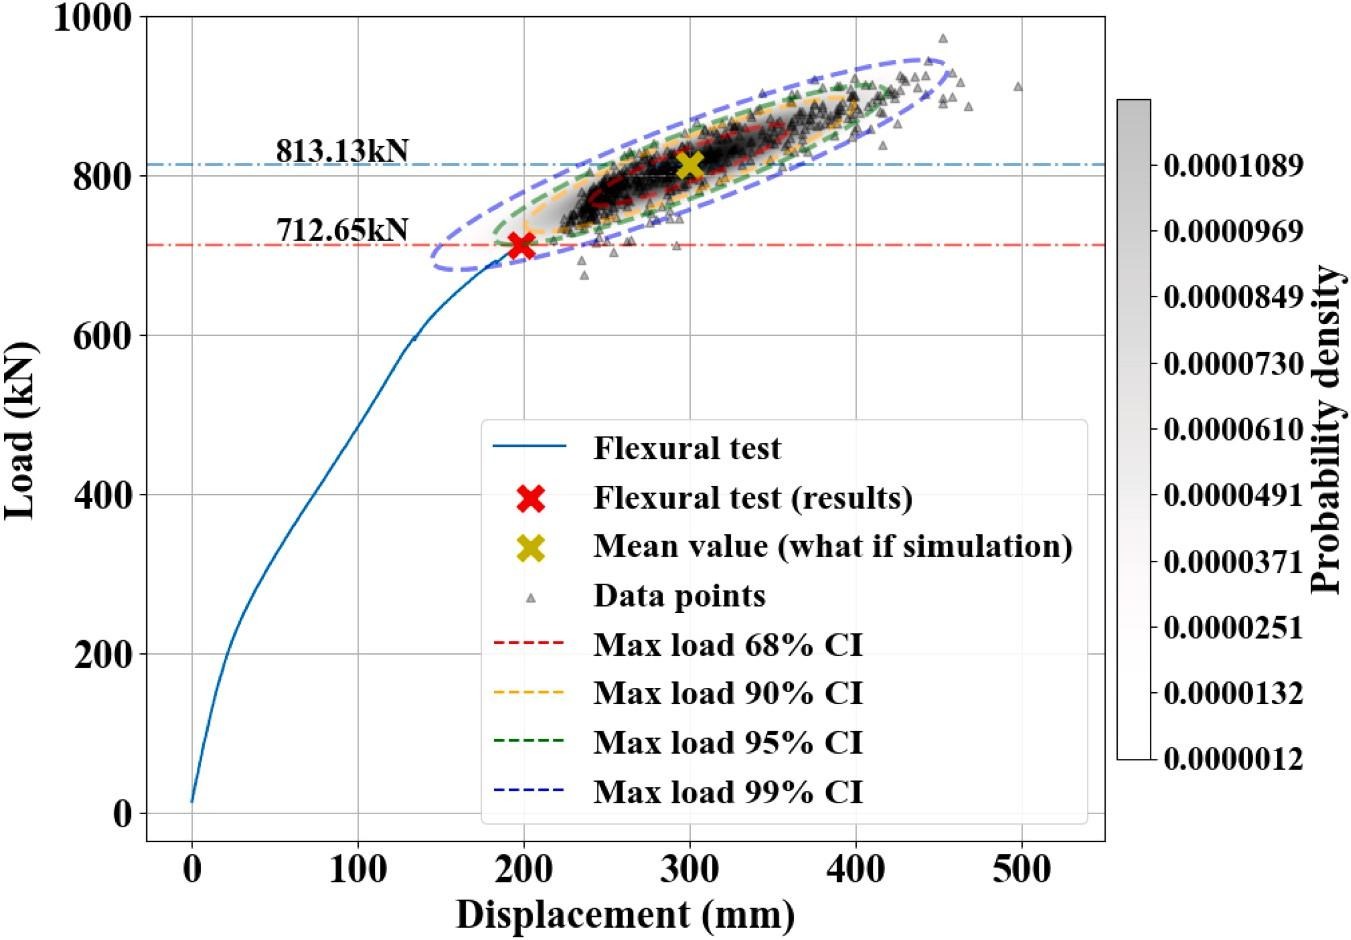
Fig. 11. What-if simulation for corroded strands in PSC girder (40 % corroded).
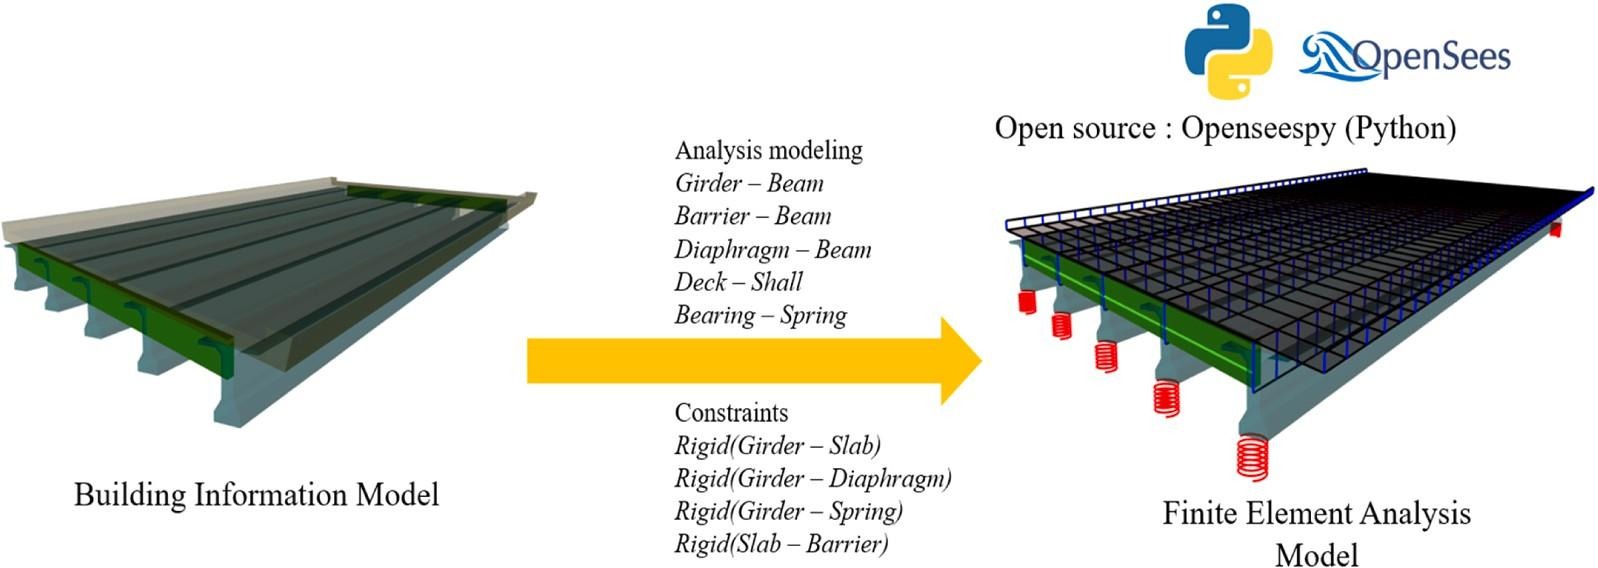
Fig. 12. Data linkage between BIM and FEA.
In the case of girders, the update was performed at the member-unit level; therefore, the updated elastic modulus was used. In the case of slabs, the compressive strength of the concrete was measured by performing actual coring and was confirmed to be 14.48 MPa higher on average than the designed average compressive strength. Because the elastic modulus of the member was different from the design value, it was selected as an updating variable; the upper limit of the update was set to 27,472 MPa, and the lower limit was set to 35,348 MPa. The criteria for the upper and lower limits were set using the elastic modulus calculation formula based on the compressive strength distribution and the compressive strength itself. When the thickness of the slab was measured, it was confirmed that the actual slab thickness was in the range of 180–300 mm compared to the existing design value of 240 mm owing to construction errors, etc., and therefore, the corresponding variable was also selected as a characteristic to be updated. With regard to the system from the perspective of a girder member, it has a bearing boundary condition, and the compression and shear stiffness values will vary depending on the detailed specifications for the bearing, allowable capacity, and type. The bridge used elastomeric bearings; the compression spring coefficient was 454,343 kN/m, and the shear spring coefficient was 1400 kN/m, to let the stiffness values allow for dead load capacity. When the condition of the bridge was assessed, damage to the bearings was found. Additionally, the deterioration damage to the elastic rubber was considered to have contributed to an increase in the spring coefficient, and thus, the corresponding characteristics were also updated. The range for reflecting the update of the elastic bearing was set to a maximum of 1.2 times the design value, considering the deterioration from the design value [38]. The load applied was a truck load, more specifically, in the form of a 6-axle truck loaded with soil. The loads on the front wheels, rear wheel 1, and rear wheel 2 were 72.89 kN, 93.34 kN, and 93.34 kN, respectively, and the total load was 259.77 kN. The load was positioned at the center of the span and bridge width based on the load on rear wheel 1, and the truck was positioned such that it faced the upbound lane.
The objective function set during updating is expressed herein as Eq. (9), and the updating characteristic variables that minimize the difference between the static deflection data that occur at the center of the girder during the load test and the static deflection of the FEA model while satisfying this condition are shown in Eq. (10) as the factors that become the components of the bridge DTM. The initial and updated values for the slab and spring models are listed in Tables 5 and 6, respectively.
Table 5
Design and updated values of updating variables for deck models
Updating variable | Description | Design value | Updated value |
|---|---|---|---|
Ec.slab1− 6 | Elastic modulus of deck | 26986 MPa | 35218, 31753, 32759, 29576, 29107, 31700 MPa |
Tc.slab1− 7 | Thickness of deck | 240 mm | 300, 300, 180, 193, 192, 238, 300 mm |
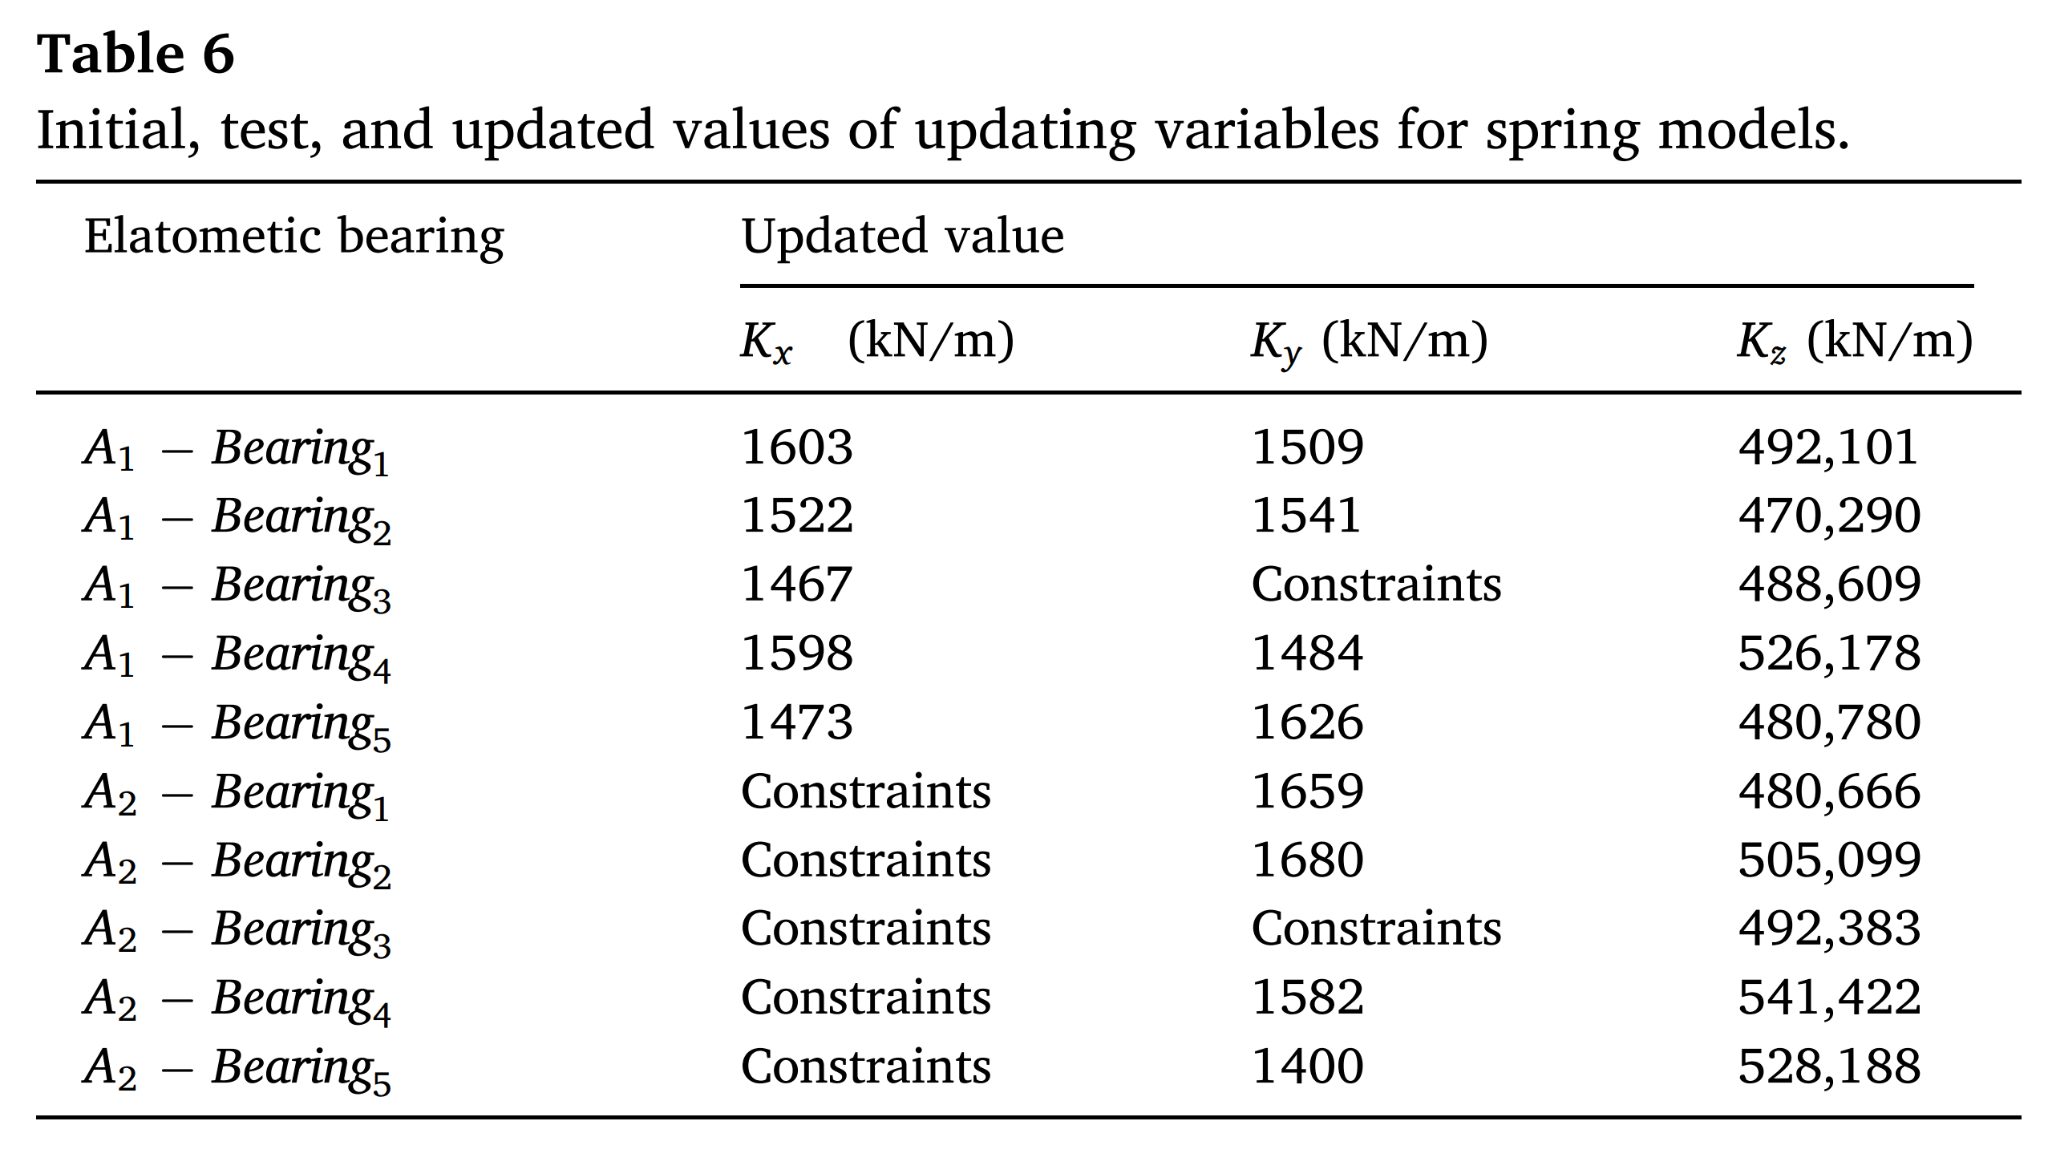
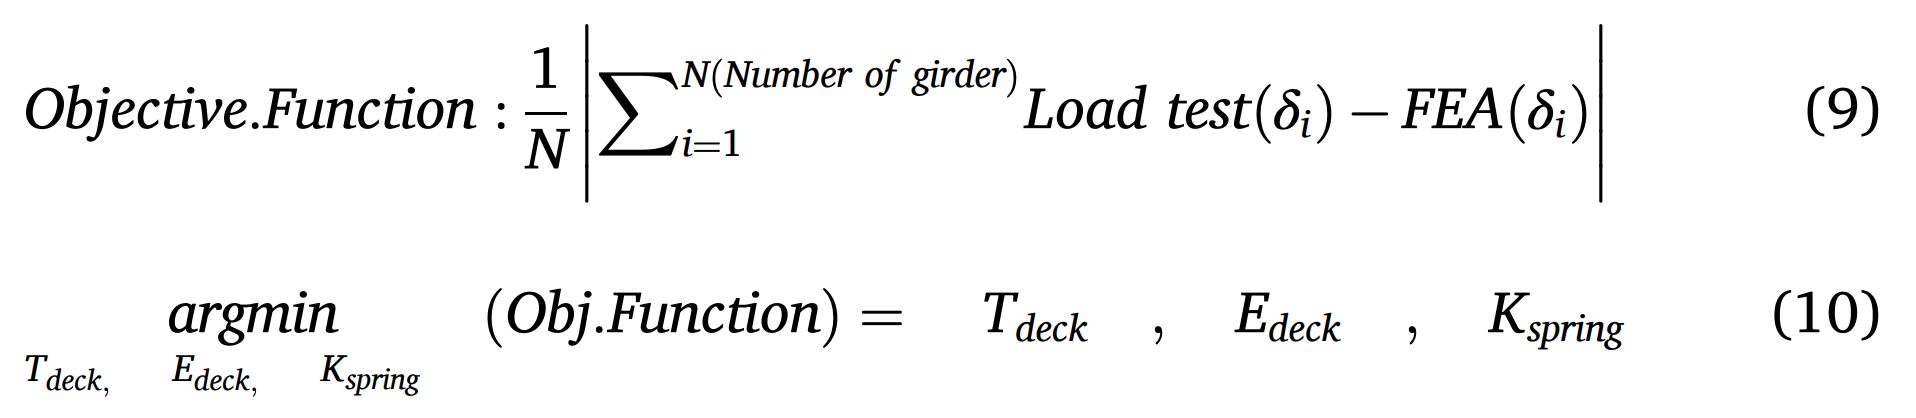
Fig. 13 shows the deflection results from three sources: the analysis model generated from the design data, the deflection obtained via the load test, and the deflection value based on the analysis model updated using PSO. When compared with the load test results, the design-databased model exhibited significant deviations in the outer girders G1 (52.8 %) and G5 (18.3 %), as well as in the inner girders G2–G4 (ranging from 3.8 % to 9.5 %), with a maximum deflection difference of approximately 0.8 mm occurring at G3. Considering that the load was applied at the center, this indicates that the stiffness of the design-based analysis model was generally higher than that of the actual bridge. In contrast, the updated analysis model reduced these deviations substantially, lowering the differences to 45.7 % in G1, 12.3 % in G5, and within 1.7–5.5 % for the remaining girders. Notably, to minimize the difference in the deflection value for the outer girders G1 and G5, the thickness and elastic modulus of the slab were updated to values that reached the upper limit, and the update factors for the remaining underestimated girders were changed to values similar to or lower than those in the existing design model.
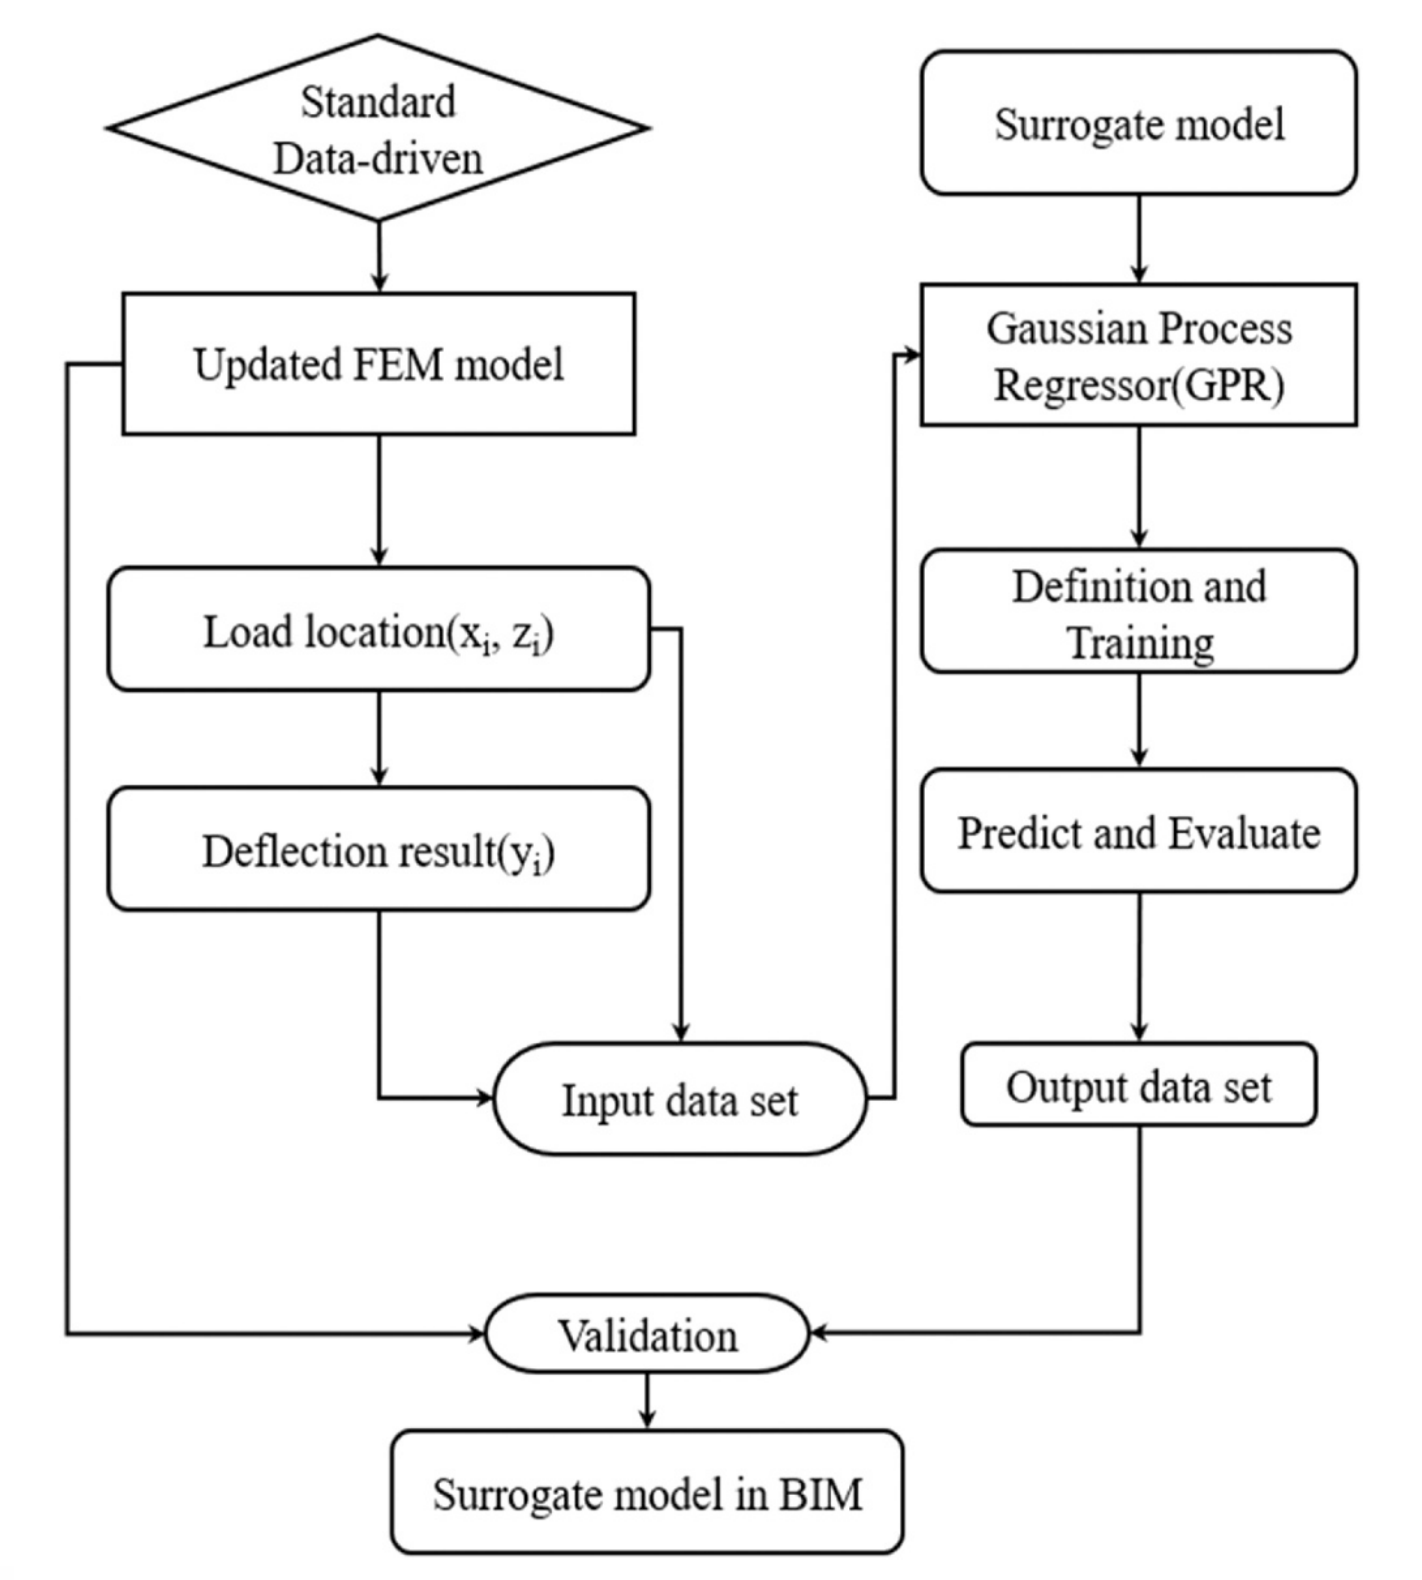
Fig. 14. Surrogate model flows using Gaussian process regression model.
5.2. Influential surface for bridge system using surrogate model
After the bridge system is updated, if the severe damage and deterioration of the bridge in use do not worsen and the live load continues to act within the design cracking load range, the updated bridge model can continuously be used. Furthermore, only the data related to the stiffness of the system or member can be acquired while the bridge is in operation. The model can be set as the baseline model after the point in time when the update is performed, and the dead load or various loads applied to the bridge can be analyzed and saved as the input and result data. Using the saved analysis data, the existing high dimensional FEA model can be replaced by a low-dimensional surrogate model that can check the stiffness of the system. The model generation process is illustrated in Fig. 14.
In this study, the analysis data for dead load locations were converted into a surrogate model and then used. If the bridge remains within the elastic range, the load and deflection are linearly proportional. Therefore, based on the principle of load superposition, the loads at each location are summed, and the magnitude of the load is applied as a multiplication factor to the deflection. In this example, a 1000 kN concentrated load was applied. In the transverse direction, the load was applied to the nodes located on top of the girders, considering the spacing between girders. In the longitudinal direction, loads were applied at 0.1 m intervals, and the displacement values corresponding to each load location were extracted for each girder. To approximate the relationship between load and deflection using a surrogate model, a regression model was employed. Although the load–deflection relationship within the bridge system is continuous and generally linear in the dataset, there is a possibility that the relationship between load position and deflection may appear nonlinear between the training and test data during model training. Accordingly, a regression model capable of capturing uncertainty in the data was adopted. Therefore, a dataset of these input and result values was used to train a GPR model. A surrogate model was created for each girder, and five girder surrogate models, G1–G5, were created. The overall 3D deflection graphs for these models are shown in Fig. 15.
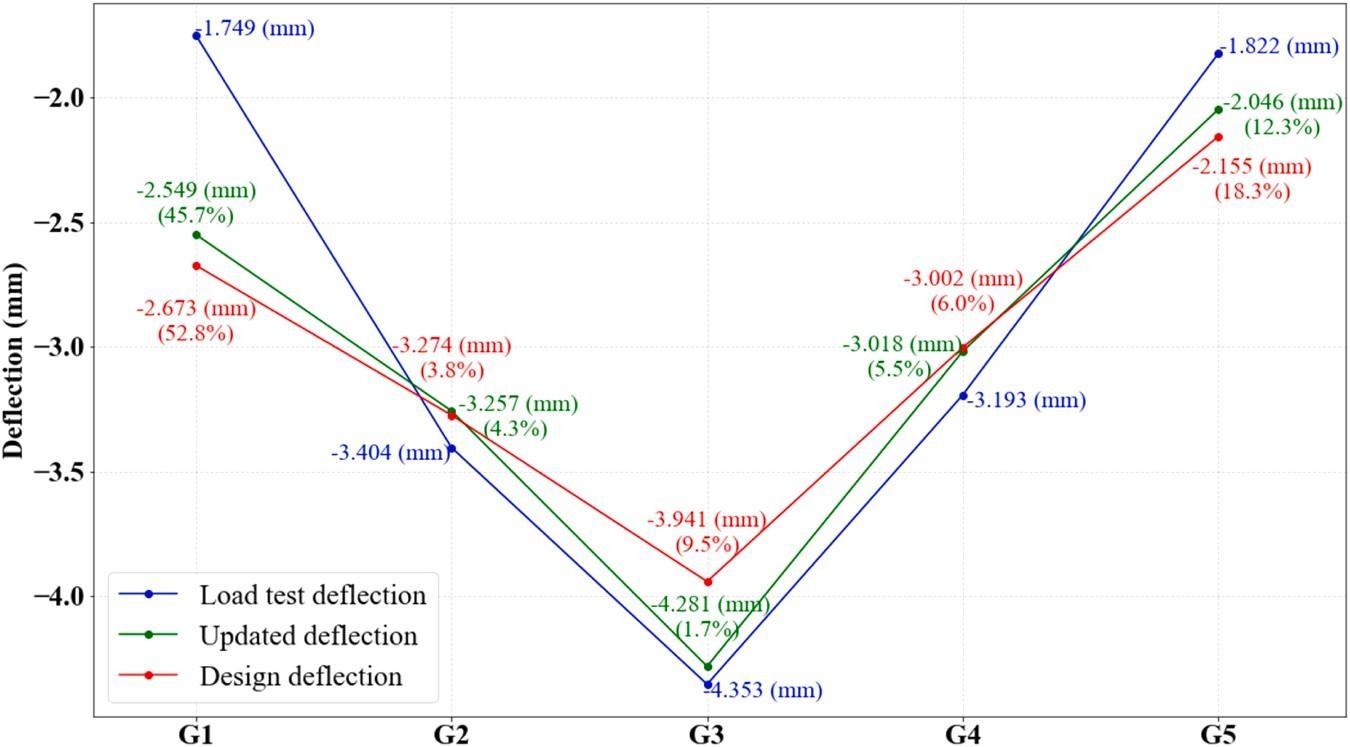
Fig. 13. Results comparison between load test, design, and updated analysis model.
To train the GPR model, the dataset was split into training and test sets at a ratio of 8:2. The kernel function used in the GPR model was the Radial Basis Function (RBF), and two hyperparameters were optimized using Optuna [39] the length scale, which controls the smoothness of the RBF kernel, and alpha, a normalization constant that accounts for observational noise. The accuracy of the surrogate models for girders G1 to G5 was evaluated using the coefficient of determination (R²), mean squared error (MSE), and the 95 % confidence interval (CI) range based on the standard deviation of the data. All five models achieved R² values close to 1.0, and the MSEs converged to zero. In addition, the uncertainty of the prediction results was very low, with the 95 % CI ranging within ±0.001 to ±0.004, indicating that highly accurate surrogate models were successfully developed. The generated model serves as a surrogate model for the system through the influential surface of the bridge, and the final surrogate model for the member-level DTM was constructed by aggregating the surrogate models for each girder.
The generated surrogate model can then be projected onto a pre-generated BIM girder model to be able to apply deformation and visualization, such as displacement of the stress contour, as shown in Fig. 16. This method can be utilized in bridge maintenance systems. If dead load data can be confirmed, the system can be managed with the BIM model, and if behavior that deviates from the surrogate model is observed, it can be defined as a point in time at which the bearing capacity of the bridge must be evaluated. The procedure used to create the existing surrogate can then be re-executed to create a new baseline model that can continuously be used to manage the bridge in an efficient manner.

6. Discussion
In this study, a digital twin model for a PSC bridge was defined and then verified via a demolished bridge. The DTM configuration and up date were performed with sufficient information on the distribution of the strength and stiffness of concrete materials, which are the biggest uncertainties in PSC bridges, and the residual stress of the prestress. A digital twin was defined for each member unit, which is an evaluation unit used during maintenance, and a baseline model of a system unit that integrates the DTMs of member units was configured. For the DTM configuration, a data system considering the life cycle, a geometry model based upon this system, and an analysis model for assessment were developed and integrated with each other, as illustrated via a system diagram linking these components.
It is possible to obtain sufficient information on the distribution of the strength and stiffness of concrete materials and the residual stress of prestress through material tests. However, most bridges currently in service are unlikely to provide such data unless a significant incident occurs. In particular, a significant discrepancy was observed between the design compressive strength and the actual strength verified through concrete specimens, while data on the elastic modulus and tensile strength of concrete is rarely available or inconsistently managed. This made it extremely difficult to define reliable mechanical properties for in-service evaluation. These issues underscore the necessity of maintaining continuous records of material test results and stiffness characteristics from the design stage through fabrication and construction. Such systematic tracking is essential to minimize the uncertainty inherent in material properties and to enhance the credibility of the digital twin model.
Therefore, to construct a DTM with higher fidelity and reliability using the method proposed in this paper, it is necessary to devise a systematic data system and a corresponding data collection method based on the life cycle management of members and bridges. The constructed DTMs interacts with values, such as visual inspections or sensors, during service and is updated. Proper bridge management requires the management of the global behavior of a bridge and the local behaviors of its members.
Acquiring real-time behavioral data of a bridge or its members for structural condition assessment represents a core function of a digital twin. However, identifying the exact causes of real-time changes directly from the bridge remains challenging. In the case of highway bridges, the uncertainty of live loads and the indeterminate qualitative or quantitative effects of deterioration in primary members on the overall structural performance remain key research challenges for advancing digital twin applications. The scope of this study is limited to developing a digital twin based on data obtained from load tests conducted at specified intervals after bridge completion. Because such load tests are performed under specified static or live loads, the uncertainty of the output data is relatively low. Considering this advantage, the present study defines the digital twin for highway bridges based on load tests conducted every 3–5 years. Once a digital twin is constructed on the basis of reliable data, incorporating real-time measurements such as acceleration or temperature into the model would enable the realization of a higher-level or more mature digital twin system. If the data on the load and deformation of the member can be obtained in real time, the load test process for evaluating the bearing capacity of the bridge, which is performed periodically, can be replaced, and the global behavior of the bridge system can be evaluated. Using the same concept, the surrogate model can be utilized after prelearning other load cases involving the bridge, and if a measured value that is outside the previously learned range is identified during bridge maintenance, it can be determined whether it is now necessary to inspect the bridge.
In the case of PSC girders, the basic assumption is that after the occurrence of flexural cracks is detected via external inspection, the degree of corrosion of the internal tendons is identified, and continuous management of strain data for future behavior tracking is performed. If the equation for evaluation is improved through the continuous collection of data, such as the ultimate strains and residual effective stresses of corroded steel wires, through data-driven machine learning, it is expected that the range of uncertainty will be reduced, and a more reliable evaluation will be made possible.
When a digital twin is defined for a concrete girder, it is essential to consider the effective prestress stress and elastic modulus of the concrete. It is very difficult to estimate the exact values of these two factors; therefore, an estimated value for reliability-based evaluation is required. In future studies, the performance of the twin model will be evaluated by reflecting the reliability-based quantification of the elastic modulus and effective stress of concrete through the observation of existing shape and material data and long-term behavior.
7. Conclusion
This study ultimately introduces the use of digital twin technology as an efficient PSC-I bridge management approach based on KPIs. By tracking the local behaviors of members through inspection diagnosis and managing the global behaviors of bridges based on their system stiffness information, a method for evaluating bridges in operation was developed without going beyond the framework of the existing maintenance system.
In the case study on assessing the local behavior of a PSC-I girder, a what-if simulation method is introduced. This method assumes possible causes based on observed visual inspection results, such as the presence of flexural cracks at the center of the girder. Through this approach, the flexural strength of the PSC-I girder without cracks can be evaluated, and the flexural capacity of girders with embedded corroded tendons can also be reliably assessed.
For evaluating the global behavior of the bridge, a surrogate model mapped onto an influential surface model is developed to reflect multiple dead load cases. This surrogate model enables the integration of real-time data from sensors, IoT devices, and the bridge DTM. Further more, it addresses a key limitation of existing bridge management systems—difficulty in associating heavy data from finite element analysis (FEA)—by incorporating a deformable BIM model.
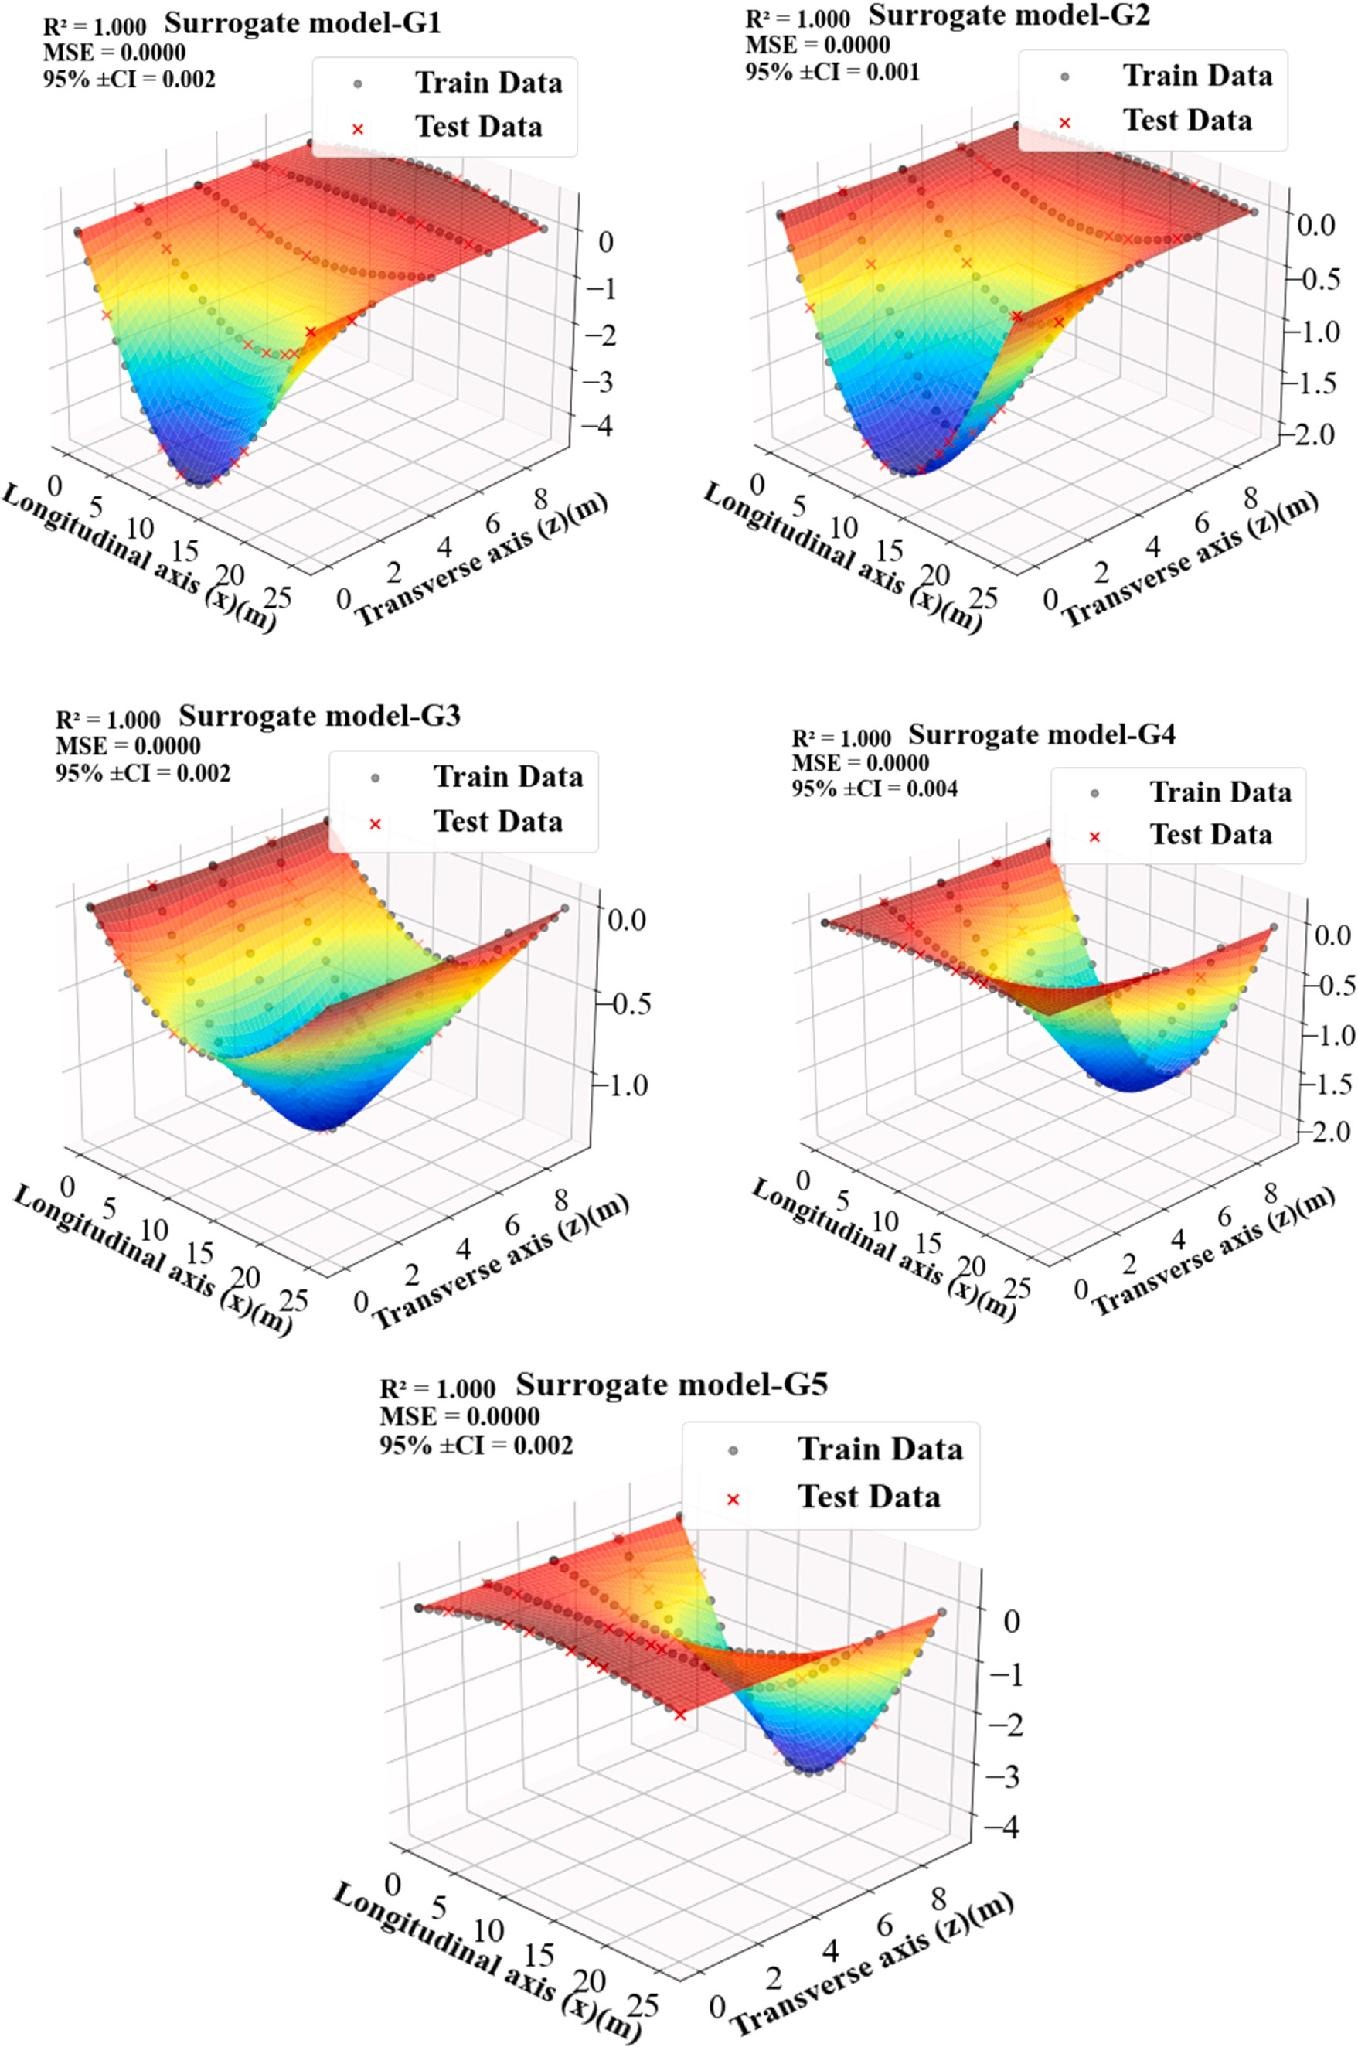
Fig. 15. Results of surrogate model for each girder.
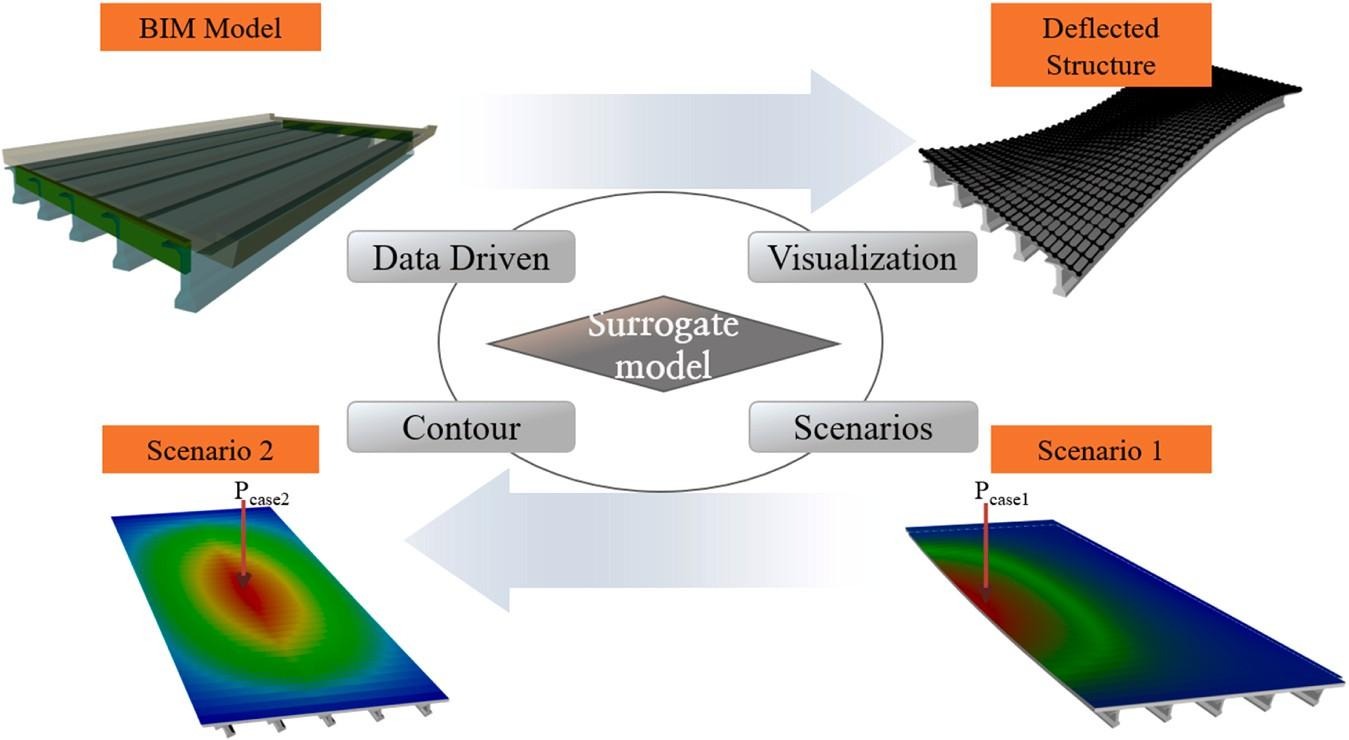
Fig. 16. Deflection contour from BIM mapping surrogate models for global behaviors.
CRediT authorship contribution statement
Jaewook Park: Visualization, Software, Investigation. Young-Joo Lee: Writing – review & editing, Validation, Supervision. Donghyun Kang: Visualization, Software, Investigation. Gitae Roh: Writing – review & editing, Writing – original draft, Visualization, Software, Methodology. Chang-Su Shim: Writing – review & editing, Validation, Supervision, Methodology, Funding acquisition, Conceptualization. Chi-Ho Jeon: Writing – review & editing, Writing – original draft, Supervision, Methodology, Funding acquisition, Conceptualization.

There are no comments yet!