
Contrast-to-noise ratio (CNR) analysis is a method of evaluating contrast resolution in an X-ray image. The CNR gives evaluation results similar to those of a visual assessment. As a result, it is frequently used clinically as a physical index for image quality control, performance comparison of modalities, and quantitative evaluation of the detectability of lesions/defects.
The imaging equipment referred to is a digital X-ray imaging device (a flat panel detector radiography system with 75 microns resolution below referred to as the FPD device) and the image phantom with simulated defect set on the detector panel of the FPD device. The X-ray tube voltage and the tube-detector distance are constant and imaging is performed by varying the X-ray tube current (the product of the X-ray tube’s current and the exposure time, below referred to as the Ma/s value).
Thus, we set the X-ray tube voltage and the tube-detector distance to 120 kV and 85 cm representing imaging conditions and obtained the phantom images by varying the mA/s values. The defect phantom images obtained under these exposure conditions were processed under inspection/clinical routine conditions, and were converted to the standard DICOM/XBit file format in which CNR analysis can be performed.
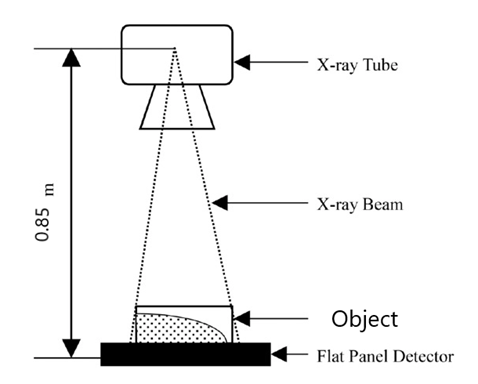
Figure A : Image, imager and x-ray source setup
SNR versus CNR
Contrast-to-noise ratio (CNR) is a measure used to determine image quality. CNR is similar to the metric signal-to-noise ratio (SNR), but subtracts a term before taking the ratio. Signal-to-noise ratio (SNR or S/N) compares the level of a desired signal to the level of background noise.
It is important to select the appropriate radiation dose (ma) such that the noise is not too high that the signal of object can be visualized above the background area (on the detector).
How Do CNR & SNR Measurements Work in Practice?
A Region of Interest (ROI) is defined on the exposed image and the image pixels are selected. Then, Vidisco’s VEO viewing software typically reports defined parameters of each ROI.
Since we have measured both signal and noise level, we’re able to calculate the SNR and CNR. CNR differs from SNR in that CNR is dependent on the local contrast. As the CNR is increased, the objects will be more easily visualized with respect to the background.
There are some ways to modify the contrast and the noise in images. Lowering the kVP will increase the contrast, while reducing the radiation dose will increase the noise. As the CNR decreases, it will be harder to differentiate the smaller signal region from the background.
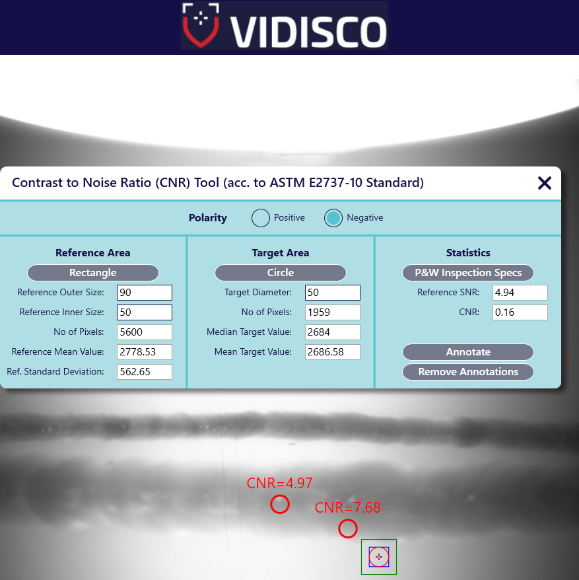
Figure B: CNR measurement by VIDISCO VEO PRO Analyze software
In Figure B, we can see a typical CNR measurement using the VIDISCO VEO Pro software, where the end user can define the required the type of reference area and target area, outer size, inner size and target diameter, so the CNR is calculated between both. In the statistic region, the end user can define the standard which he needs to meet.
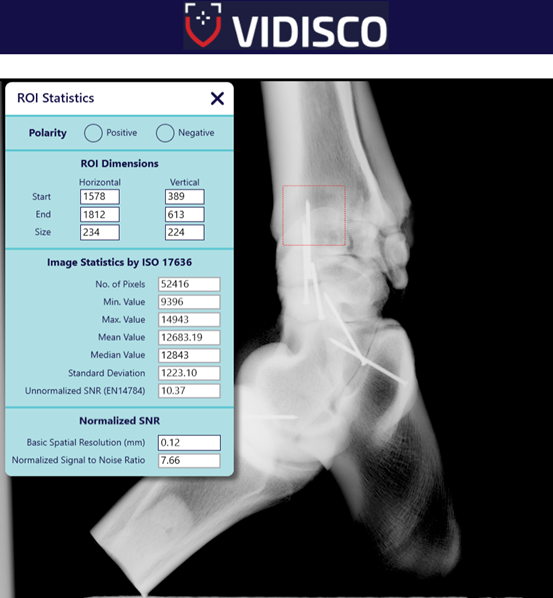
Figure C: SNR measurement by VIDISCO VEO PRO Analysis software
Figure C shows a typical SNR measurement using the VIDISCO VEO Pro software, where the end user can define the required ROI and image polarity image, so the normalized SNR will be calculated in the ROI, taking into consideration that the spatial resolution was detected and calculated according to the desired standard by the duplex wire exposure.
The CNR can be worked out based on the measurement within ROI in the radiographic image. Identifying small defects in a uniform background depends on the contrast in the region of interest.


