Phased Array Inspection
ERW Pipe Weld Tracking Using Phased Array
Published on 31st July 2023
Introduction
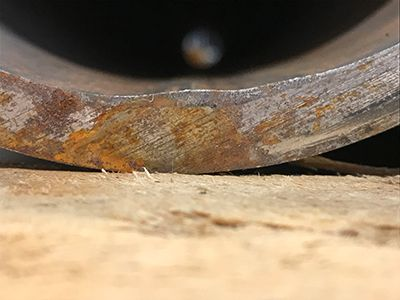
Electric resistance welded (ERW) pipes are formed from steel coils using a continuous process that involves unfurling the coils, feeding the steel plates through tube mills, and then joining the edges longitudinally using electronic resistance welding. Misalignment of the plate edges can result in a deviation of the weld throughout the entire forming process.
Challenges
To perform weld inspection during ERW pipe manufacturing, an operator must visually track the weld to make sure that the flaw detection probes are aligned with the center of the weld. The problem with this manual tracking method is that it relies on the operator’s skill and unwavering concentration for the inspection to be done properly.
Solution
During manufacturing, a scarfing tool is used to remove any excess material resulting from the welding process. This operation introduces changes in the wall thickness (WT) on both sides of the weld. This alteration of the profile can be monitored using the phased array-based weld profiling and tracking function of Olympus’ ERW In-Line or Off-Line inspection system.
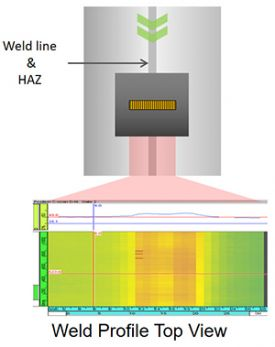
The probe required for this function of the ERW pipe inspection system is a curved phased array (PA) probe that is long enough to extend past the heat-affected zone (HAZ) on both sides of the weld. It scans the targeted area by firing longitudinal waves at zero degrees to provide a side view of the weld.
An algorithm based on time-of-flight analysis uses the difference in WT caused by the scarfing process to extrapolate the position of the weld.
Conclusion/Key Benefits
The results show that with the ERW In-Line or Off- Line system, phased array technology can be used to automatically track the weld and eliminate dependence on visual tracking by an operator. Removing this variable helps achieve reliable 100% inspection of the weld. Traceability is ensured within the pipe data file because both flaw information and weld tracking data are recorded.
Furthermore, real-time data enables users to visualize the weld profile and scarfing area, providing immediate feedback on the welding and scarfing process. They can perform their analysis without having to wait until the pipe is cut, minimizing the quantity of affected material if the scarfing tool is worn or damaged.
The scarfing area position in relation to the center of the probe can be used for position correction if rTable Propertiesequired. The weld profile algorithm measures any weld seam deviation along the pipe and provides information for probe adjustment.
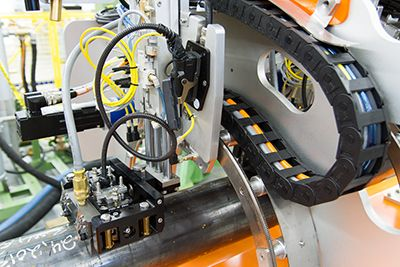
The phased array probe is attached to a motorized carriage fixed to a circular rail positioned around the pipe perimeter, so it can automatically follow the weld. Likewise, flaw detection probes are fixed to a similar structure and receive the position information from the weld profiling probe so they can reposition themselves automatically.
Results
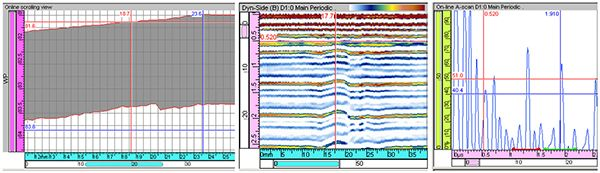
The figure below shows an example of the weld tracking data displayed by the Olympus ERW In-Line and Off-Line systems. The upper four charts present the weld inspection information; the lower two charts present the weld detected position and the WT C-scan data used to track the weld.
This detected weld position is sent in real time to the PLC to reposition the probes using the servomotor-driven mechanisms for each probe, ensuring that the weld and HAZ are properly inspected along the entire length of the pipe.
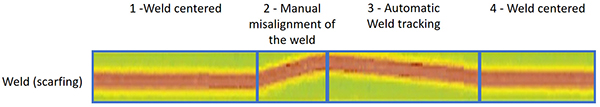
In the figure shown below, a phased array probe was positioned over the center of the weld, and acoustic results of the WT measurement were recorded. The pipe was then voluntarily misaligned to test the automatic weld tracking function. As the scan shows, the phased array probe automatically recenters itself over the center of the weld.


