If you’ve ever wondered whether there’s a more efficient way to perform weld screening than simply scrolling through B-scans, you’ll want to hear about our solution. With the MXU 5.13 software update, we introduced an innovative B-scan view for the OmniScan™ X3 series that has the potential to revolutionize this time- and attention-consuming technique. Used as a validation tool, it can give you more confidence in your assessments and help ease the whole B-scan screening process.
We call it the merged B-scan, and here’s why:
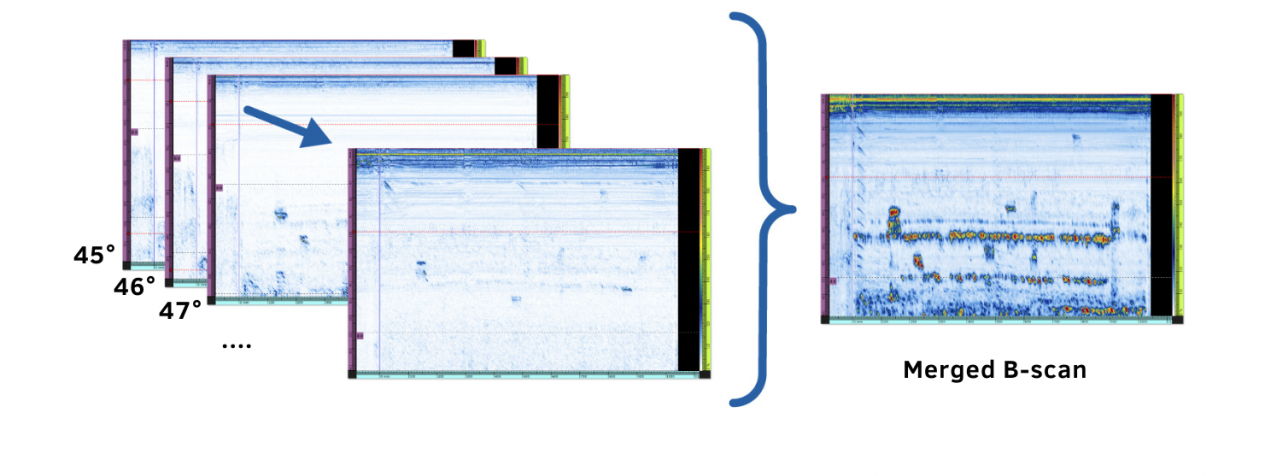
- The software takes the cross-sectional B-scan slices you’re used to seeing and effectually superimposes them.
- Then all the B-scans are presented on the OmniScan X3 display in one easy-to-interpret view.
How Does the Merged B-Scan Work?
Imagine that an S-scan is a folding fan with transparent pleats or fins. The merged B scan is like closing the fan and looking through all fins.
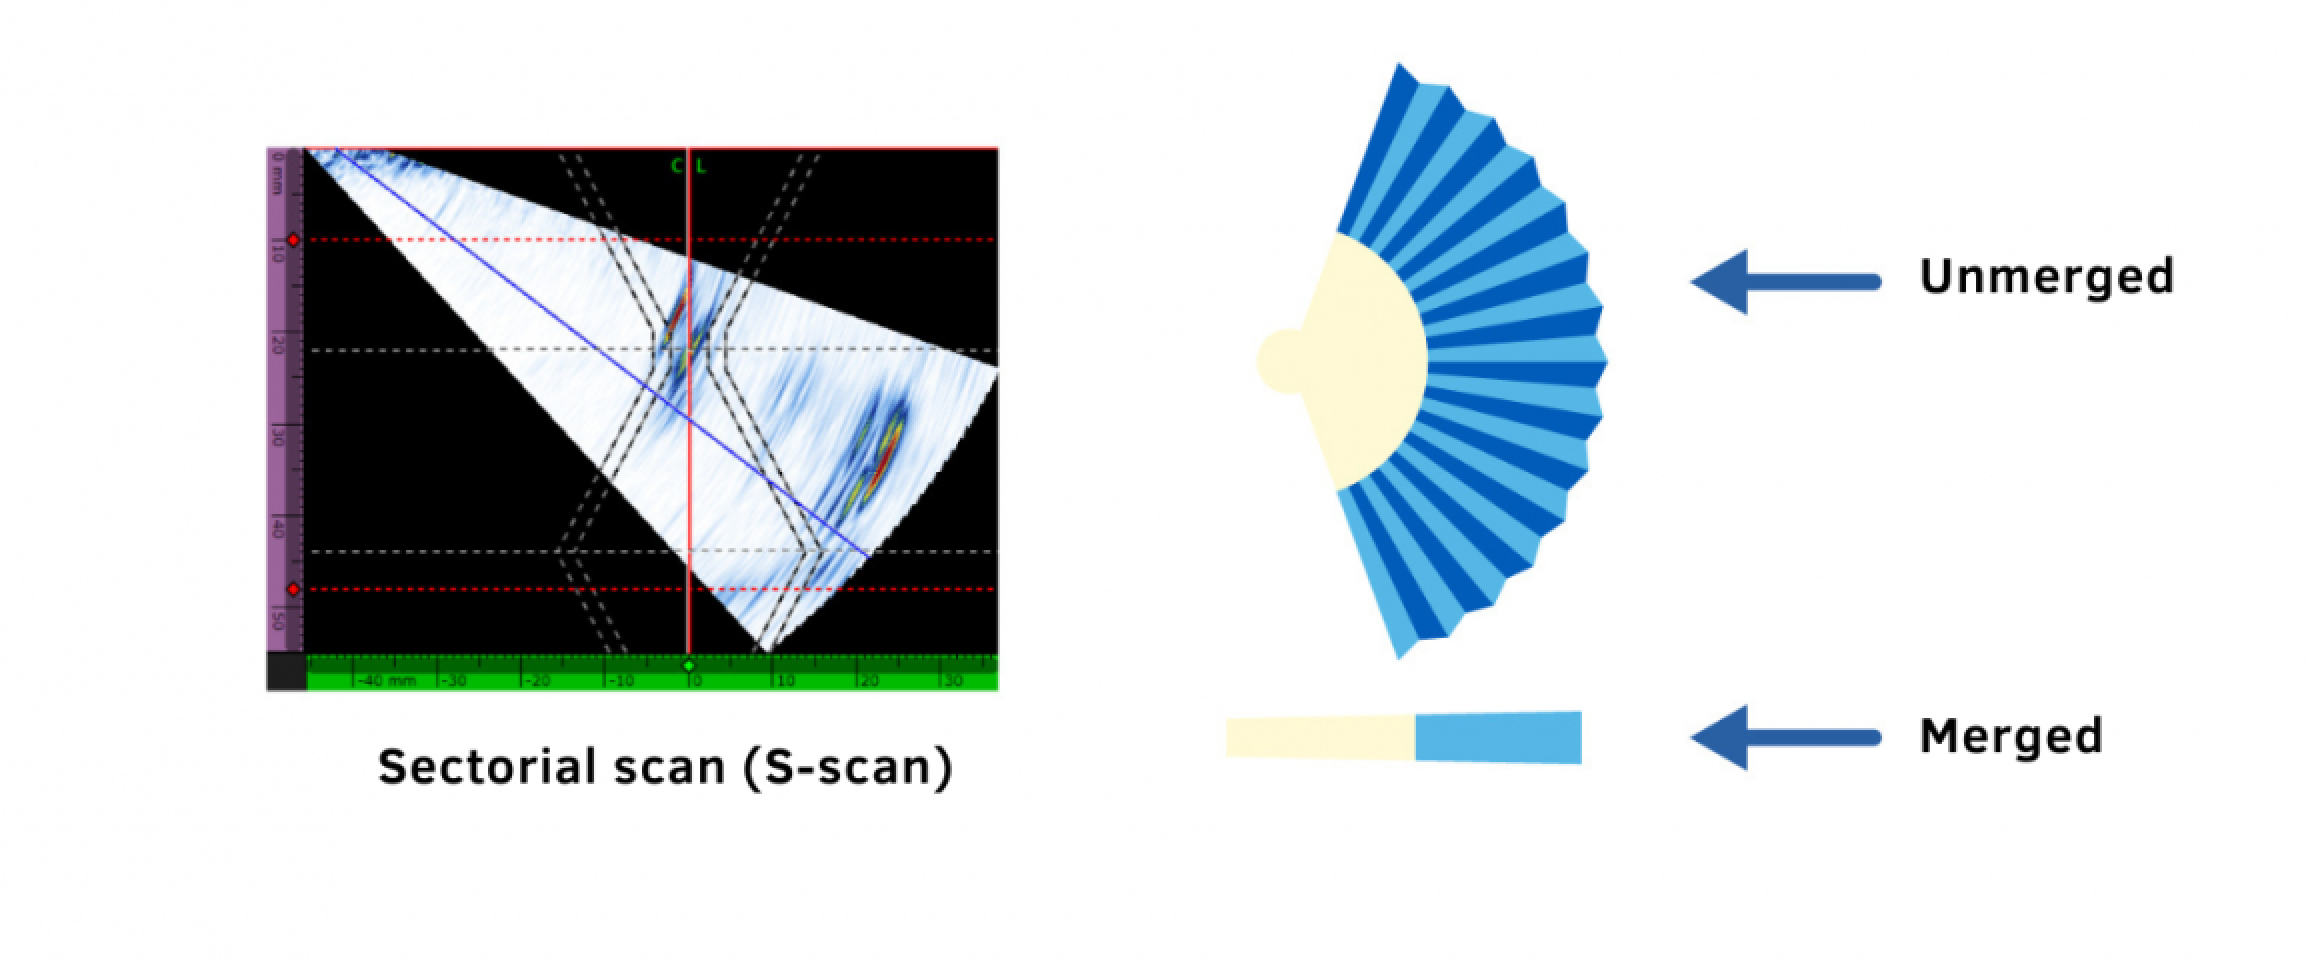
In a standard PAUT sector scan, the data acquired for each ultrasound axis position (regardless of indication depth) is merged using the maximum amplitude for each beam of a sector scan and for each scan position (slice) so potential indications are combined perpendicularly with each beam’s propagation axis. The merged B-scan is an uncorrected view that doesn’t involve any compression, so no data is lost.
That said, there are other factors to consider when choosing to use the merged B-scan. Its detection performance is best when the sound path distribution of indications in welds is variable, which is generally naturally occurring, and it’s most useful in the first leg and the beginning of the second leg. But not all welds and PAUT configurations are the same and, in some cases, especially with sector scans covering a large portion of the weld, there can be weld geometry indications that occur at a similar sound path. Without adjustments, these conditions wouldn’t be optimal for to use of the merged B-scan, but the good news is that careful selection of the first and last beams used for the merge can result in an improved representation that is still highly valuable for flaw screening.
Phased Array Ultrasonic Testing (PAUT) B-Scan Basics
Even those who are familiar with the B-scan may sometimes mistakenly describe it as a “side view.” This is only an accurate statement when talking about 0-degree inspections (such as for wall thickness measurements). It doesn’t truly apply when it comes to angle beam inspections, such as those used in weld inspection. This is because, with angle beam sector scans, individual B-scans actually show different beams, each traveling at a different angle relative to the surface (or the depth axis perpendicular to it).
B-scan screening techniques are commonly taught to and used by a phased array (PA) inspectors for weld inspection applications. In the case of a sectorial scan, scrolling through one B-scan after the other is like scrolling through a planar image generated by each of the splayed beams of the S-scan in time. Weld inspectors typically apply the B-scan data view when evaluating the depth of indications and determining which ones are deepest.
However, identifying and evaluating flaws using this technique typically requires concentration in order to:
- Recognize the patterns that help you distinguish suspected flaws from geometry echoes.
- Compare the severity and depth of suspected flaws from B-scan to B-scan.
The merged B-scan helps relieve some of the effort involved and streamlines your weld inspection and analysis process through the powerful capabilities it provides. Complementing the standard B-scan screening technique, the merged B-scan can give you confidence in your assessments.
The following is a summary of the top 5 advantages it offers:
1. Perform Easier and Faster Screening
The merged B-scan stands to save inspectors a lot of time and mental energy. Since all the indications detected in the weld can be seen in a single data view, it’s easy to spot suspected flaws at a glance and confirm that you didn’t misinterpret or miss anything.
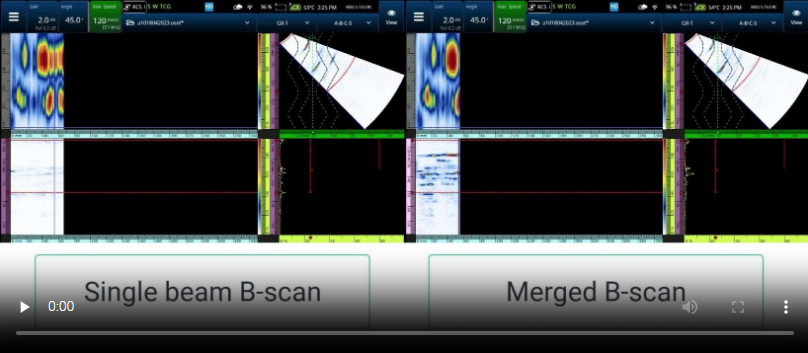
With all the data presented in one view, you can clearly distinguish suspect indications from geometry echoes and associated drift.
Additionally, viewing both merged and unmerged B-scans is facilitated by the new and improved layouts included with the MXU 5.13 update:
- The B-S-A single group layout displays a larger B-scan view
- A new A-B-S multigroup layout shows multiple B-scans without the need to toggle. Groups can be merged or unmerged individually to ease comparison and interpretation.
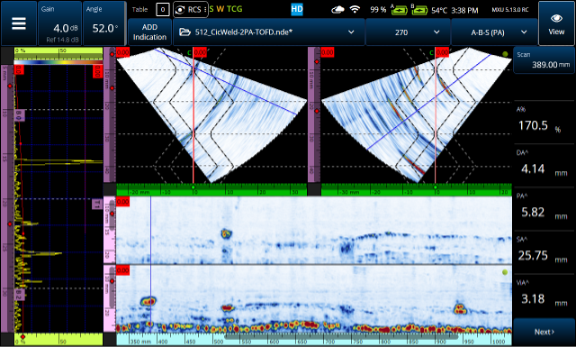
A-B-S multiple layouts show multiple B-scans simultaneously on the OmniScan X3 display
The A-B-S multiple layouts show multiple B-scans (merged or unmerged) without the need to toggle between displays. Additionally, each group can be merged or unmerged individually to facilitate comparison and data interpretation.
2. Isolate the Relevant Angles for a Cleaner Image
You can make the merged B-scan image even cleaner by carefully selecting only the beams that are contributing to the analysis. Adjusting the first and last beam in the data source parameters can make suspect indications stand out much more clearly from nonrelevant echoes.
3. Validate the Accuracy of Your Flaw Screening Assessments
The OmniScan X3 quick access menu enables you to switch back and forth between the standard B-scan view and the merged B-scan. Simply press and hold in the B-scan data display to open the menu, and then select Use Active Beam, and Activate Merged B-Scan.
You can use it during live acquisition as well as during post-acquisition analysis. Try it and you’ll immediately see its value as a way to compare the B-scan data and validate your analysis with confidence.
4. Confirm the Depths of Flaws without Hesitation
Since the merged B-scan shows all the beams including the ones revealing the deepest indications, you can use it to help confirm the location of the deepest flaw. You’ll note a particular improvement in this respect on cracks originating at the far surface.
Finding the deepest portion of such flaws is made easier by positioning the scan cursor of the merged B-scan. Then you can complete the characterization using the S-scan as usual.
5. Thoroughly Analyze and Evaluate All Your Data, Past and Present
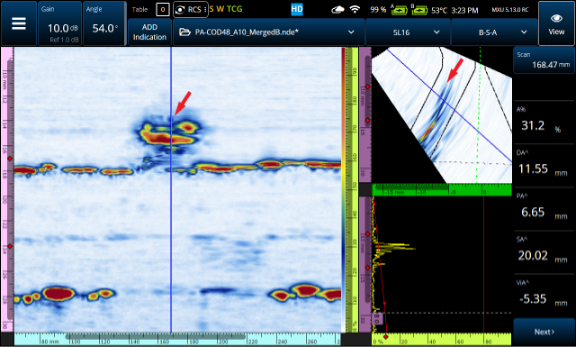
Scan cursor positioned over the deepest part of the flaw in the merged B-scan
The merged B-scan “looks” at echoes from a time-of-flight perspective, where beam spread has no significant impact. This makes it easy to pinpoint the deepest part of the flaw in the merged B-scan and position the scan cursor over it.
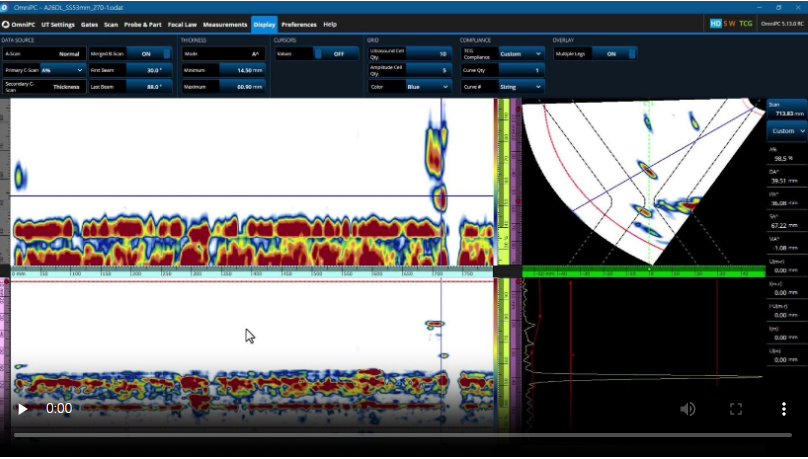
As mentioned, the merged B-scan view can be used on the OmniScan X3 unit during data acquisition and post-acquisition either on the unit or on your computer using OmniPC™ software. Since OmniPC software is compatible with all past and present OmniScan data file formats (including .opd and .oud), when you update to OmniPC 5.13, you can then apply the merged B-scan to previously acquired data. This includes data files acquired with OmniScan MX2 and SX flaw detectors.
Bonus Benefit: Ease the Learning Curve for B-Scan Screening Techniques
If you’ve any experience using and interpreting B-scans, then you will have no trouble adapting to the merged B-scan. Learning B-scan screening techniques will also be much easier for beginners since the merged B-scan shows all the beams including the ones revealing the deepest indications.
Furthermore, because it uses the same B-scan layouts and tools that exist in MXU and OmniPC software, any level OmniScan user can easily adapt this technique to augment their analysis toolkit. If you’re interested in knowing more, don’t hesitate to contact your local Evident representative and, in the meantime, check out our OmniScan X3 webpage